


Demography is the study of human populations, focusing on their size and structure (age, sex and ethnicity). This blog article reviews the population of Northen Ireland, and focuses on the three principal factors which together determine population change – fertility (births), mortality (deaths) and migration – to illustrate how the population has changed over time. But first, here are some key facts:
Key facts
Population
- Just before the famine (1841), the estimated population of what is now Northern Ireland stood at 1,649,000, after which there was a long decline. The population stabilised at 1,237,000 by 1901, and began to increase thereafter. The latest census (2021) recorded a figure of 1,903,100. At 30 June 2024, Northern Ireland’s population was estimated to be 1,927,900 people.
- The Northern Ireland population is ageing. In 1974, the median (average) age was 28.6 years; fifty years later (2024) it had increased to 40.3 years.
Births
- Similar to most Western countries, birth rates, and the number of live births in Northern Ireland, have been falling steadily in recent decades. In 1964, a total of 34,345 births were recorded; by 2024, this figure had fallen to 19,416.
- The fall would have been much steeper were it not for the growing number of births in Northern Ireland to mothers born outside the UK and Ireland. In Belfast, for example, 22 per cent of all births recorded in 2024 were to mothers born outside the British Isles.
- In 2023, Northern Ireland had a total period fertility rate (TPFR) of 1.64 children per woman, well below the replacement level of 2.1 children per woman.
Deaths
- Mortality rates are increasing, and the gap between births and deaths is beginning to close. In 2008, there were 25,631 births and 14,907 deaths, a difference of 10,724. By 2024, births had fallen to 19,416 while the number of deaths had risen to 18,050, a gap of only 1,366.
- The number of deaths is projected to exceed the number of births for the first time in mid-2031, and continue to be higher thereafter.
Migration
- Between 2001 and 2024, over 310,000 long-term international migrants are estimated to have arrived in Northern Ireland, while 242,000 migrants left, leaving a net total international migration flow of 68,000 people.
- When residents of a White ethnicity born in Eastern Europe are included in the figures, the number of residents belonging to minority ethnic groups in Northern Ireland may be as high as 153,000 (8.1% of the population).
- The number of Newcomer pupils (where English is an additional language) has more than doubled in the past thirteen years, from 8,674 in 2011 to 21,352 in 2024/25, and now account for 6.0 per cent of all school enrolments.
- Brexit, which ended freedom of movement for EU citizens, ushered in a significant change in migration patterns. In 2024, for example, there were only 101 registrations from Polish people compared with 3,041 from India.
- Since 2016, the number of racist crimes recorded by the PSNI has exceeded the number of sectarian crimes. In 2024/25, for example, there were 1,188 crimes with a racist motivation compared with 588 crimes with a sectarian motivation.
- At 31 March 2026, there were 2,379 asylum seekers in receipt of support in Northern Ireland.
Population of Northern Ireland in 2024
At 30 June 2024, Northern Ireland’s population was estimated to be 1,927,900 people. Just over half (50.7 per cent) were female, with 978,100 females compared with 949,800 males (49.3 per cent).
Northern Ireland has an ageing population. Figure 1 presents a population pyramid, comparing the age composition of the population in 2014 and 2024. It shows that in 2024, the pyramid begins to broaden from age 50 onwards, indicating a growth in the number of older persons (both sexes) compared with a decade earlier.

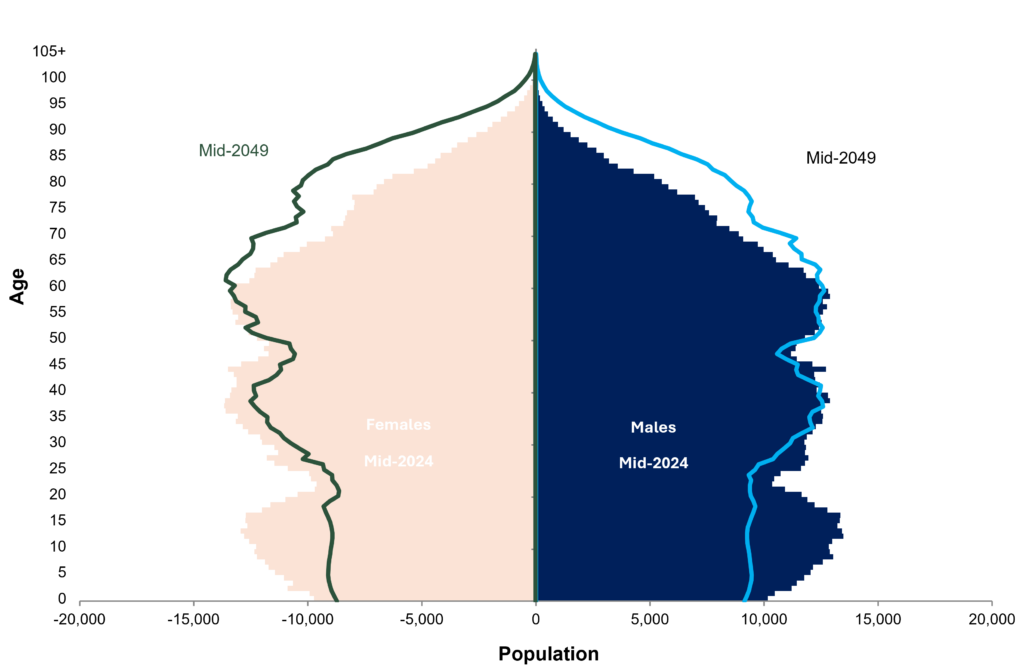
The proportion of older people (aged 65+) rose from 13.1 per cent in 1999 to 18.1 per cent in 2024, an increase of five percentage points. Further confirmation that the population is ageing comes from a review of the Median age [1]. In 1974, the median age of the population was 28.6 years; fifty years later (2024) it had increased to 40.3 years, with similar rises for males and females.
Births
Similar to most Western Countries, birth rates, and the number of live births in Northern Ireland, have been falling steadily in recent decades. Table 1 clearly illustrates this trend by presenting birth statistics for the series 1964–2024 (ten-year intervals). In 1964, a total of 34,345 births were recorded; by 2024, this figure had fallen to 19,416.
Table 1: Live Births by Sex, 1964–2024
| 1964 | 1974 | 1984 | 1994 | 2004 | 2014 | 2024 | |
| All persons | 34,345 | 27,160 | 27,477 | 24,098 | 22,318 | 24,394 | 19,416 |
| Males | 17,615 | 13,987 | 14,196 | 12,361 | 11,477 | 12,543 | 9,989 |
| Females | 16,730 | 13,173 | 13,281 | 11,737 | 10,841 | 11,851 | 9,427 |
Source: NISRA (2016, 2025) Registrar General Annual Reports, Birth Statistics (available here)
The fall in the number of births during the past few decades would have been much steeper were it not for the growing number of births to mothers born outside the UK and Ireland.
Births to Mothers born outside UK and Ireland
Table 2 presents the number of births (at five-year intervals), 1997–2024, in Northern Ireland broken down by country of birth of the mother.
Table 2: Births in Northern Ireland by Country of Birth of Mother, 1997–2024
| Registration Year | Total (All countries) | NI, other UK, ROI | EU A8 | Rest of World [2] | Not Stated | A8 + Rest of World (%) |
| 1997 | 24,087 | 23,518 | 2 | 542 | 25 | 2.6% |
| 2002 | 21,385 | 20,640 | 16 | 708 | 21 | 3.9% |
| 2007 | 24,451 | 22,504 | 775 | 1,170 | 2 | 8.9% |
| 2012 | 25,269 | 22,810 | 1,201 | 1,258 | – | 10.8% |
| 2017 | 23,075 | 20,654 | 1,041 | 1,380 | 0 | 10.5% |
| 2022 | 20,837 | 18,435 | 632 | 1,770 | 0 | 11.5% |
| 2023 | 19,962 | 17,555 | 507 | 1,900 | 0 | 12.1% |
| 2024 | 19,416 | 16,926 | 446 | 2,044 | 0 | 12.8% |
Source: NISRA (2016, 2025) Registrar General Annual Reports, Birth Statistics, available here
In 1997, only two babies in Northern Ireland were born to mothers from the European Union Accession (A8) countries [3]. By 2008, this figure had risen to 1,080, and hovered around the 1,200 mark for some years. After Brexit, however, births to A8 mothers declined, reaching a low of 446 in 2024. Meanwhile births to mothers born in the rest of the world (excluding the UK, Ireland, and the A8) increased substantially, from 542 in 1997 to 2,044 in 2024.
Table 2 shows that births to mothers born outside the UK and Ireland now account for around 13 per cent of all births in Northern Ireland each year. The comparable figure in 1997 was 2.6 per cent.
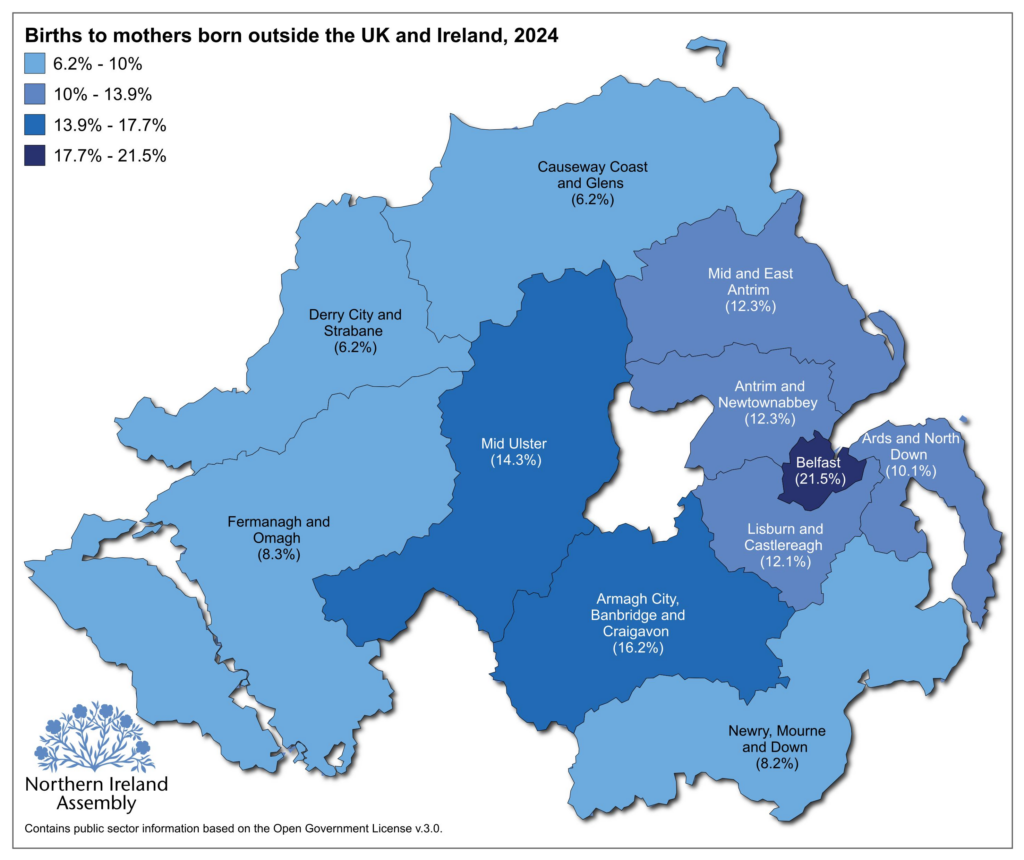
Map 1 shows the proportion of births to non-UK and Ireland-born mothers by LGD in 2024. In Belfast more than one in five of all births (21.5%) were to mothers born outside the British Isles, followed by Armagh City, Banbridge and Craigavon (16.2%) and Mid Ulster (14.3%). The Derry City and Strabane council area (6.2%) had the lowest proportion of such births.

To replace itself, a population requires a fertility rate of 2.1 children per woman over her lifetime. Northern Ireland is similar to most Western countries in that current fertility rates are well below this figure (1.64 in 2023).
While birth rates are falling in Northern Ireland, the number of deaths are beginning an inexorable rise, with significant consequences for the population.
Deaths
As noted earlier, the Northern Ireland population is getting older, and deaths occur more frequently in an ageing population. Table 3 lists the number of deaths at five-year intervals between 1994–2024. The table reveals that mortality rates remained relatively stable between 1994 and 2019 but have started to rise since then [4].
Table 3: Deaths by Sex, 1994–2024
| Male | Female | All | |
| 1994 | 7,362 | 7,752 | 15,114 |
| 1999 | 7,464 | 8,199 | 15,663 |
| 2004 | 6,935 | 7,419 | 14,354 |
| 2009 | 6,914 | 7,499 | 14,413 |
| 2014 | 7,024 | 7,654 | 14,678 |
| 2019 | 7,790 | 7,968 | 15,758 |
| 2022 | 8,548 | 8,611 | 17,159 |
| 2023 | 8,571 | 8,683 | 17,254 |
| 2024 | 9,234 | 8,816 | 18,050 |
Source: NISRA (2025) Registrar General Annual Report, Death statistics, Table 5.1 (available here)
With birth rates falling and death rates continuing to rise, the gap between both is closing. Figure 2 illustrates the latest population projections (2024-based) for births and deaths. It shows that the number of deaths is projected to exceed the number of births for the first time in mid-2030, and continue to be higher for the rest of the projection period (until 2049).

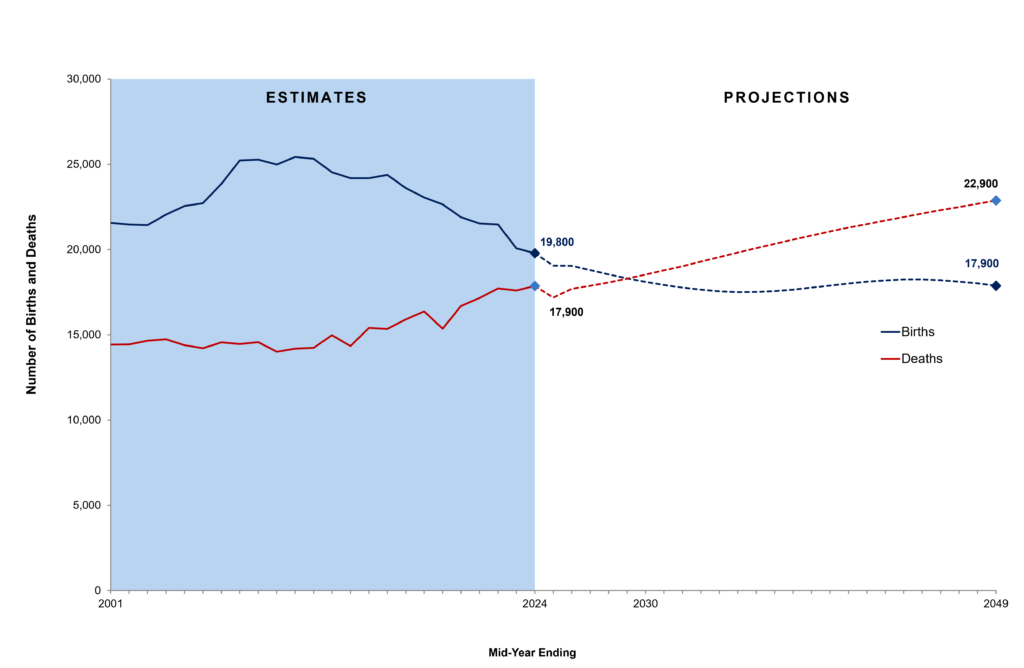
Population growth is a function of two factors, namely natural increase (births minus deaths) and migration. When the number of deaths exceeds the number of births, the population is no longer being replaced and will begin to decline, unless fertility rates increase or net migration moves into positive territory.
Migration
Since the Millennium, Northern Ireland has witnessed an unprecedented wave of international migration, initially from Central and Eastern Europe, but more recently from Africa and Asia. Between 2000 and 2024, an estimated 310,000 long-term international migrants arrived in Northern Ireland, and 242,000 migrants left, leaving a net total international migration flow of 68,000 people (Figure 3). In the process, Northern Ireland moved from a position of net migration loss to one of annual population gain.
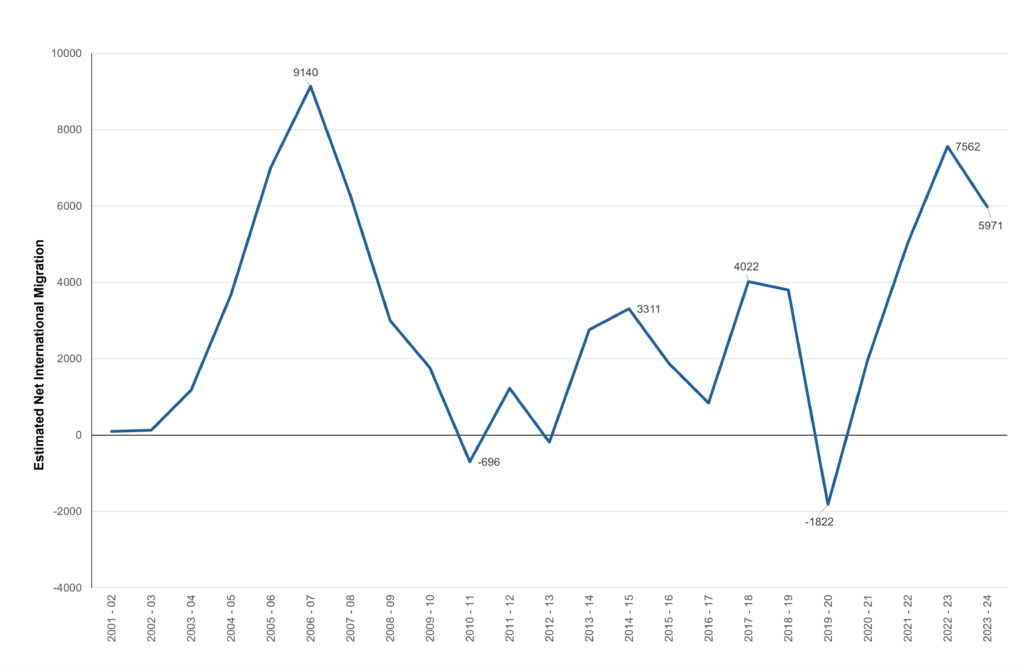
The surge in international migration to Northern Ireland began after EU enlargement in 2004, when eight countries from Central and Eastern Europe joined the Union. However, a significant change in migration patterns took place after Brexit in 2020.
International migration – countries of origin
The UK left the European Union on 31 January 2020. Brexit ended freedom of movement for EU citizens and, as Table 4 reveals, the change in migration patterns since then has been striking. In the decade before Brexit (2010–2020) Poland (16,000) was the top country of origin for international migrants coming to Northern Ireland, followed by Ireland (16,000), Romania (9,200) and Lithuania (8,700). Overall, seven of the top 10 countries of origin were in Europe.
Table 4: International Inflows by Top 10 Countries of Origin, 2010–2020, and 2024
| 2010–2020 | 2024 | ||
| Nationality | Count | Nationality | Count |
| Poland | 16,086 | India | 3,041 |
| Ireland | 15,935 | Philippines | 1,841 |
| Romania | 9,244 | Ireland | 1,377 |
| Lithuania | 8,672 | Nigeria | 957 |
| China | 5,365 | Zimbabwe | 556 |
| India | 5,338 | Pakistan | 542 |
| Bulgaria | 5,056 | China | 364 |
| Portugal | 4,242 | South Africa | 312 |
| U.S.A. | 3,663 | Somalia | 309 |
| Slovakia | 3,030 | USA | 286 |
| Other | 48,548 | Other | 5,494 |
| Total | 125,178 | Total | 15,079 |
Source: BSO Medical Card registrations
Fast forward to 2024, and Table 4 shows that only one of the top 10 countries of origin is in Europe (Ireland), while four are African and four are Asian. India was the top country of origin (3,000) in 2024, followed by the Philippines (1,800), Ireland (1,400) and Nigeria (1,000). Polish registrations plummeted to 101.
Figures for the period 2001–2024 demonstrate that most migrants are young, with 88.6 per cent under the age of 35 years. International migration is also balanced in terms of sex: during the period 2001–2024, females accounted for 48.2 per cent of international migrants and males 51.8 per cent.
The growing diversity of life in Northern Ireland is reflected in the composition of the school population.
Newcomer pupils
Schools in Northern Ireland are becoming increasingly ethnically diverse, with a growing number of ‘Newcomer’ pupils. A Newcomer pupil is one who has enrolled in a school but who does not have the satisfactory language skills to participate fully in the school curriculum, and does not have a language in common with the teacher, whether that is English or Irish. This category, which has previously been referred to as English as an Additional Language, is primarily composed of children from a minority ethnic background.
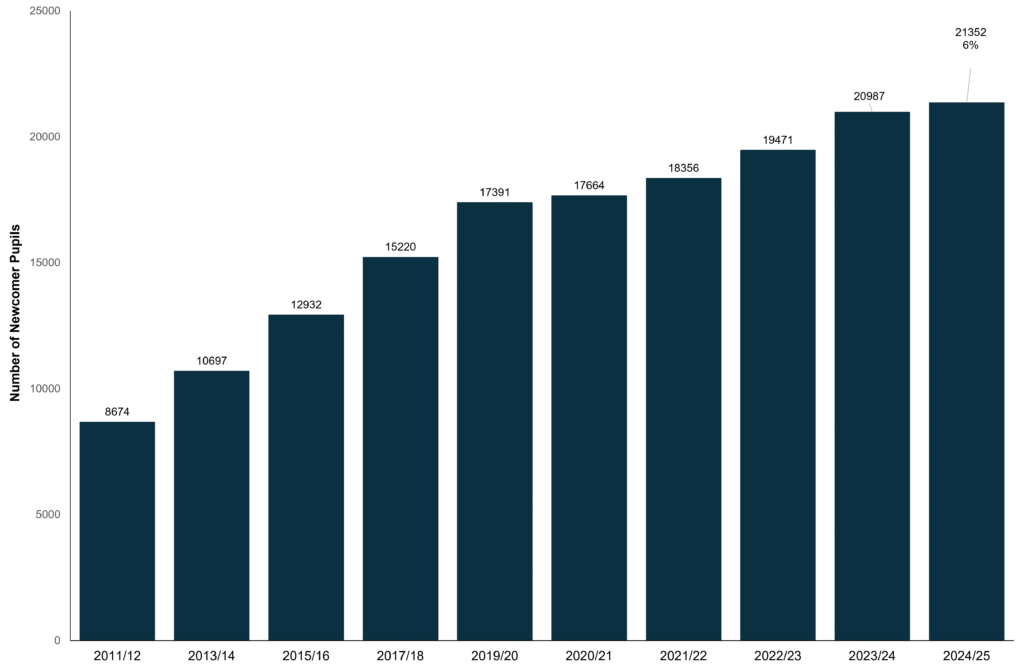
Figure 4 reveals that the number of Newcomer pupils has more than doubled in the past thirteen years, from 8,674 in 2011 to 21,352 in 2024/25, and now accounts for 6.0 per cent of all school enrolments. In some schools the proportion of Newcomer pupils is much higher than the average figure, including 75 primary schools where the percentage is 20 per cent or more.
Table 5: Ten Primary Schools with highest proportion of Newcomer Pupils, 2024/25
| Primary School | No. of Newcomer Pupils | Per cent (%)
Newcomers |
Total school Population |
| Presentation Primary School, Portadown | 244 | 92.1% | 265 |
| St Patrick’s Primary School, Dungannon | 772 | 88.0% | 877 |
| Fane Street Primary School, Belfast | 243 | 82.1% | 296 |
| Dungannon Primary School | 236 | 73.8% | 320 |
| Botanic Primary School, Belfast | 145 | 70.4% | 206 |
| St Mary’s Primary School, Belfast | 90 | 68.2% | 132 |
| Ballymena Primary School | 131 | 60.6% | 216 |
| Harryville Primary School, Ballymena | 137 | 59.8% | 229 |
| Mount St Catherine’s Primary School, Armagh | 93 | 58.5% | 159 |
| Holy Rosary Primary School, Belfast | 233 | 53.3% | 437 |
Source: Department of Education (2025) School level – primary schools data, 2024/25, available here
Table 5 lists the ten primary schools with the largest proportion of Newcomer pupils. The list includes schools in Belfast, Ballymena, Dungannon, Portadown and Armagh. For example, in October 2024, 244 out of 265 pupils (92%) in Presentation Primary School, Portadown were Newcomers, while in Botanic Primary School, Belfast, 70 per cent were Newcomers.
Regarding post-primary schools, there are five schools (October 2024) where the percentage of Newcomers is 20 per cent or more, and 20 schools where the proportion is 10 per cent or more.
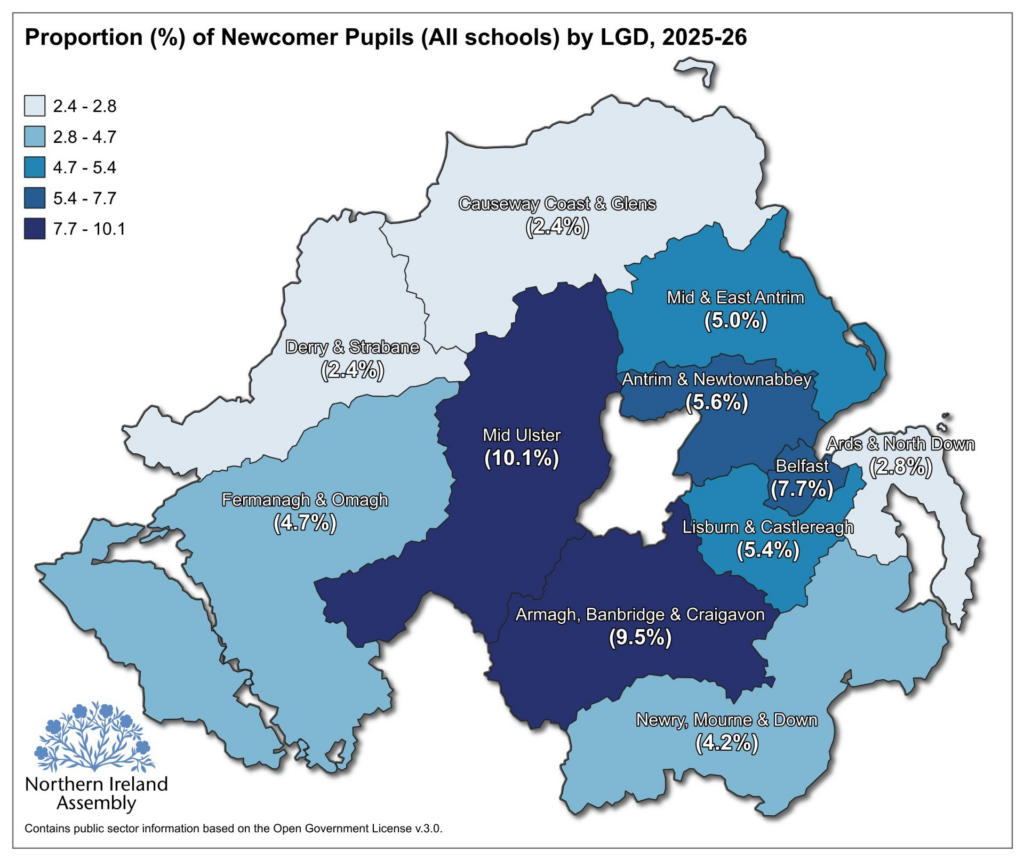
Map 2 shows the proportion (%) of Newcomer pupils in all schools (primary and post-primary) in each of the eleven local government districts (LGDs) in October 2024. Mid Ulster (10.1%) and Armagh, Banbridge and Craigavon (9.5%) had the highest proportion of such pupils, followed by Belfast (7.7%), while Derry City and Strabane, and Causeway Coast and Glens (2.4%) had the smallest proportion.
Previous sections have outlined trends in births, deaths and migration – the three components of population change. The final section brings these three components together, and examines how they are likely to influence demographic change over the next two decades.
Population projections
Population projections provide an estimate of the future size and age structure of the population. They are widely used in policy development in areas such as housing, health and social care, pensions, and education. NISRA published the latest 2024-based population projections in April 2026.
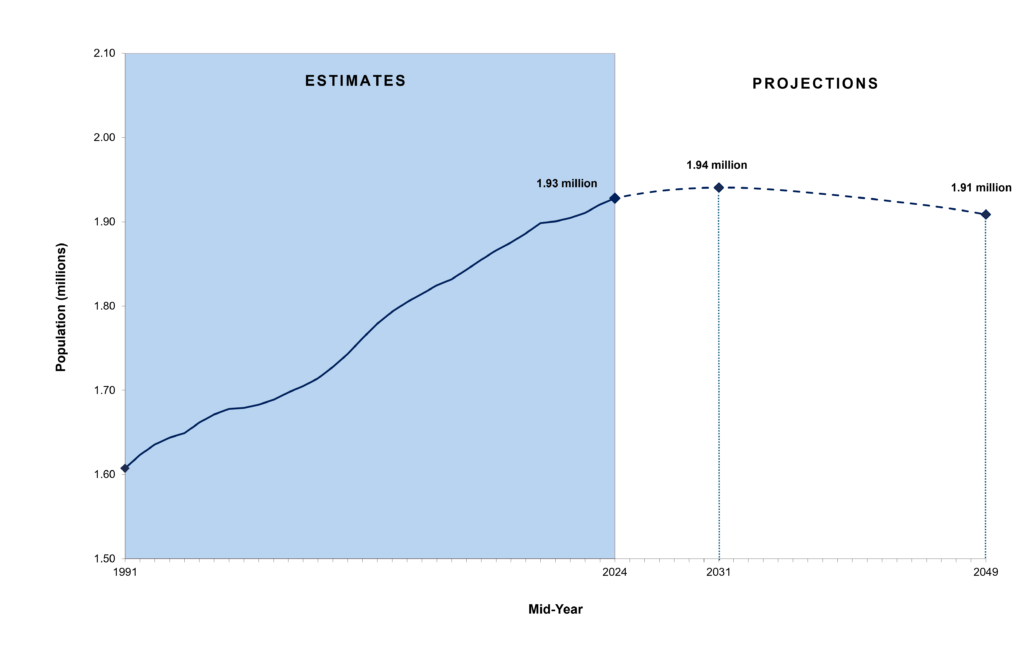
Figure 5 shows that the population is projected to peak at 1.94 million in 2031, thereafter declining to 1.91 million by 2049. Deaths are projected to exceed births from 2030 onwards, creating negative natural change (i.e. births minus deaths). This trend has important implications for the size of the population; essentially, it means that, unless fertility rates increase, population growth will largely depend upon the level of net migration. More explicitly, without steady migration the population of Northern Ireland is likely to fall.
In brief, Northern Ireland has an ageing population, with the median age projected to rise, from 40.3 years in mid-2024 to 46.8 years by mid-2049. For the next few decades, the Province will come to rely more and more on the contribution of its young, migrant workforce, not only to maintain our public services, but also to pay the taxes required to support our children and elderly residents.
The complete research paper from the Assembly Research and Information Service is available for download.
_______________________
[1] The Median age is the middle score in a distribution of scores, with half the scores below the median and half above. It is a measure of central tendency (average).
[2] Rest of World excludes births to mothers born in Northern Ireland, GB, Republic of Ireland and the EU A8 Accession countries.
[3] The European Union A8 Accession countries are the eight Central and Eastern European nations that joined the EU on May 1, 2004: Czech Republic, Estonia, Hungary, Latvia, Lithuania, Poland, Slovakia, and Slovenia.
[4] The increase in deaths since 2019 can be partially accounted for by the COVID-19 pandemic. There were 3,692 deaths involving COVID-19 in Northern Ireland between 1 March 2020 and 31 October 2021, accounting for 13.0% of all deaths during this period. This figure does not include deaths resulting from the knock-on effects of the Pandemic on other health conditions, such as late diagnosis and fewer hospital visits etc.