Death and serious injury from road traffic collisions (RTCs) are tragic events bringing untold pain and suffering on families. At the same time, through better understanding of what causes them and targeting appropriate action, they are preventable.
Road safety in the border region
A 2002 report [PDF | 6mb] detailing the health and wellbeing of residents of the border region identified a 33% higher death rate from RTCs in the border region than in the rest of Ireland. The perception at that time was that this phenomenon was due to road users outside their own jurisdictions being less attentive to the rules of the road or somehow confused by differing regulations.
Identification of this statistic prompted the cross-border body CAWT (Cooperation and Working Together), a partnership between the Health and Social Care Services in Northern Ireland (NI) and Republic of Ireland (ROI), to embark on a detailed research initiative, combining a number of research methods, that would produce an empirical knowledge base sufficient to guide future policy interventions aimed at tackling the rates of death and injury from road traffic accidents within the region.
Steering to safety
The project, entitled ‘Steering to Safety’, saw a range of reports published providing analysis of various RTC trends, driver behaviour and attitudes to things like speeding. It was noted in the summary report that there was indeed a higher proportion of fatal and serious collisions in the border area. However, there were differences between each jurisdiction with the number of serious and fatal accidents in ROI increasing between 1998 and 2003 whereas NI experienced a reduction. Focus group data highlighted a casual attitude to drink driving, and suggested mobile phone usage was ‘very high’. Police reports also indicated there was a high occurrence of fatalities that could be attributed to not wearing seatbelts.
While not conclusive, the Steering to Safety report highlighted four contributory factors to the increased frequency of fatal and serious accidents in the border:
- A culture of racing or ‘joy riding’ which varied at different parts of the border;
- The peripherality of the border region contributing to higher car dependency rates i.e. more time spent driving;
- The poor quality of roads; and
- Mixed messages or emphasis placed on RTCs each side of the border which undermine the effectiveness of any influence on behaviour for those regularly criss-crossing border roads.
Focus groups suggested the main ways in which drivers from both sides of the border feel that other drivers change their behaviour on crossing the border are increased speed, greater aggression, reduced compliance with traffic rules and less caution. Observations on the A1, the main road between Belfast and the border (at Newry), found that more than half of all cars, from both sides of the border, were exceeding the speed limit.
Non-compliance with civil traffic regulations by non-resident drivers is a trend observed across the EU, and the issue has been closely scrutinised by the European Commission. The Steering to Safety report found that 1 in 5 fatalities occurring in each jurisdiction were non-residents. Enforcement has been highlighted as a major factor at both the EU level and locally where the Criminal Justice Inspection NI, stated that a deficiency in road policing enforcement over many years, will have been a significant factor in the number of accidents on border roads.
Border roads
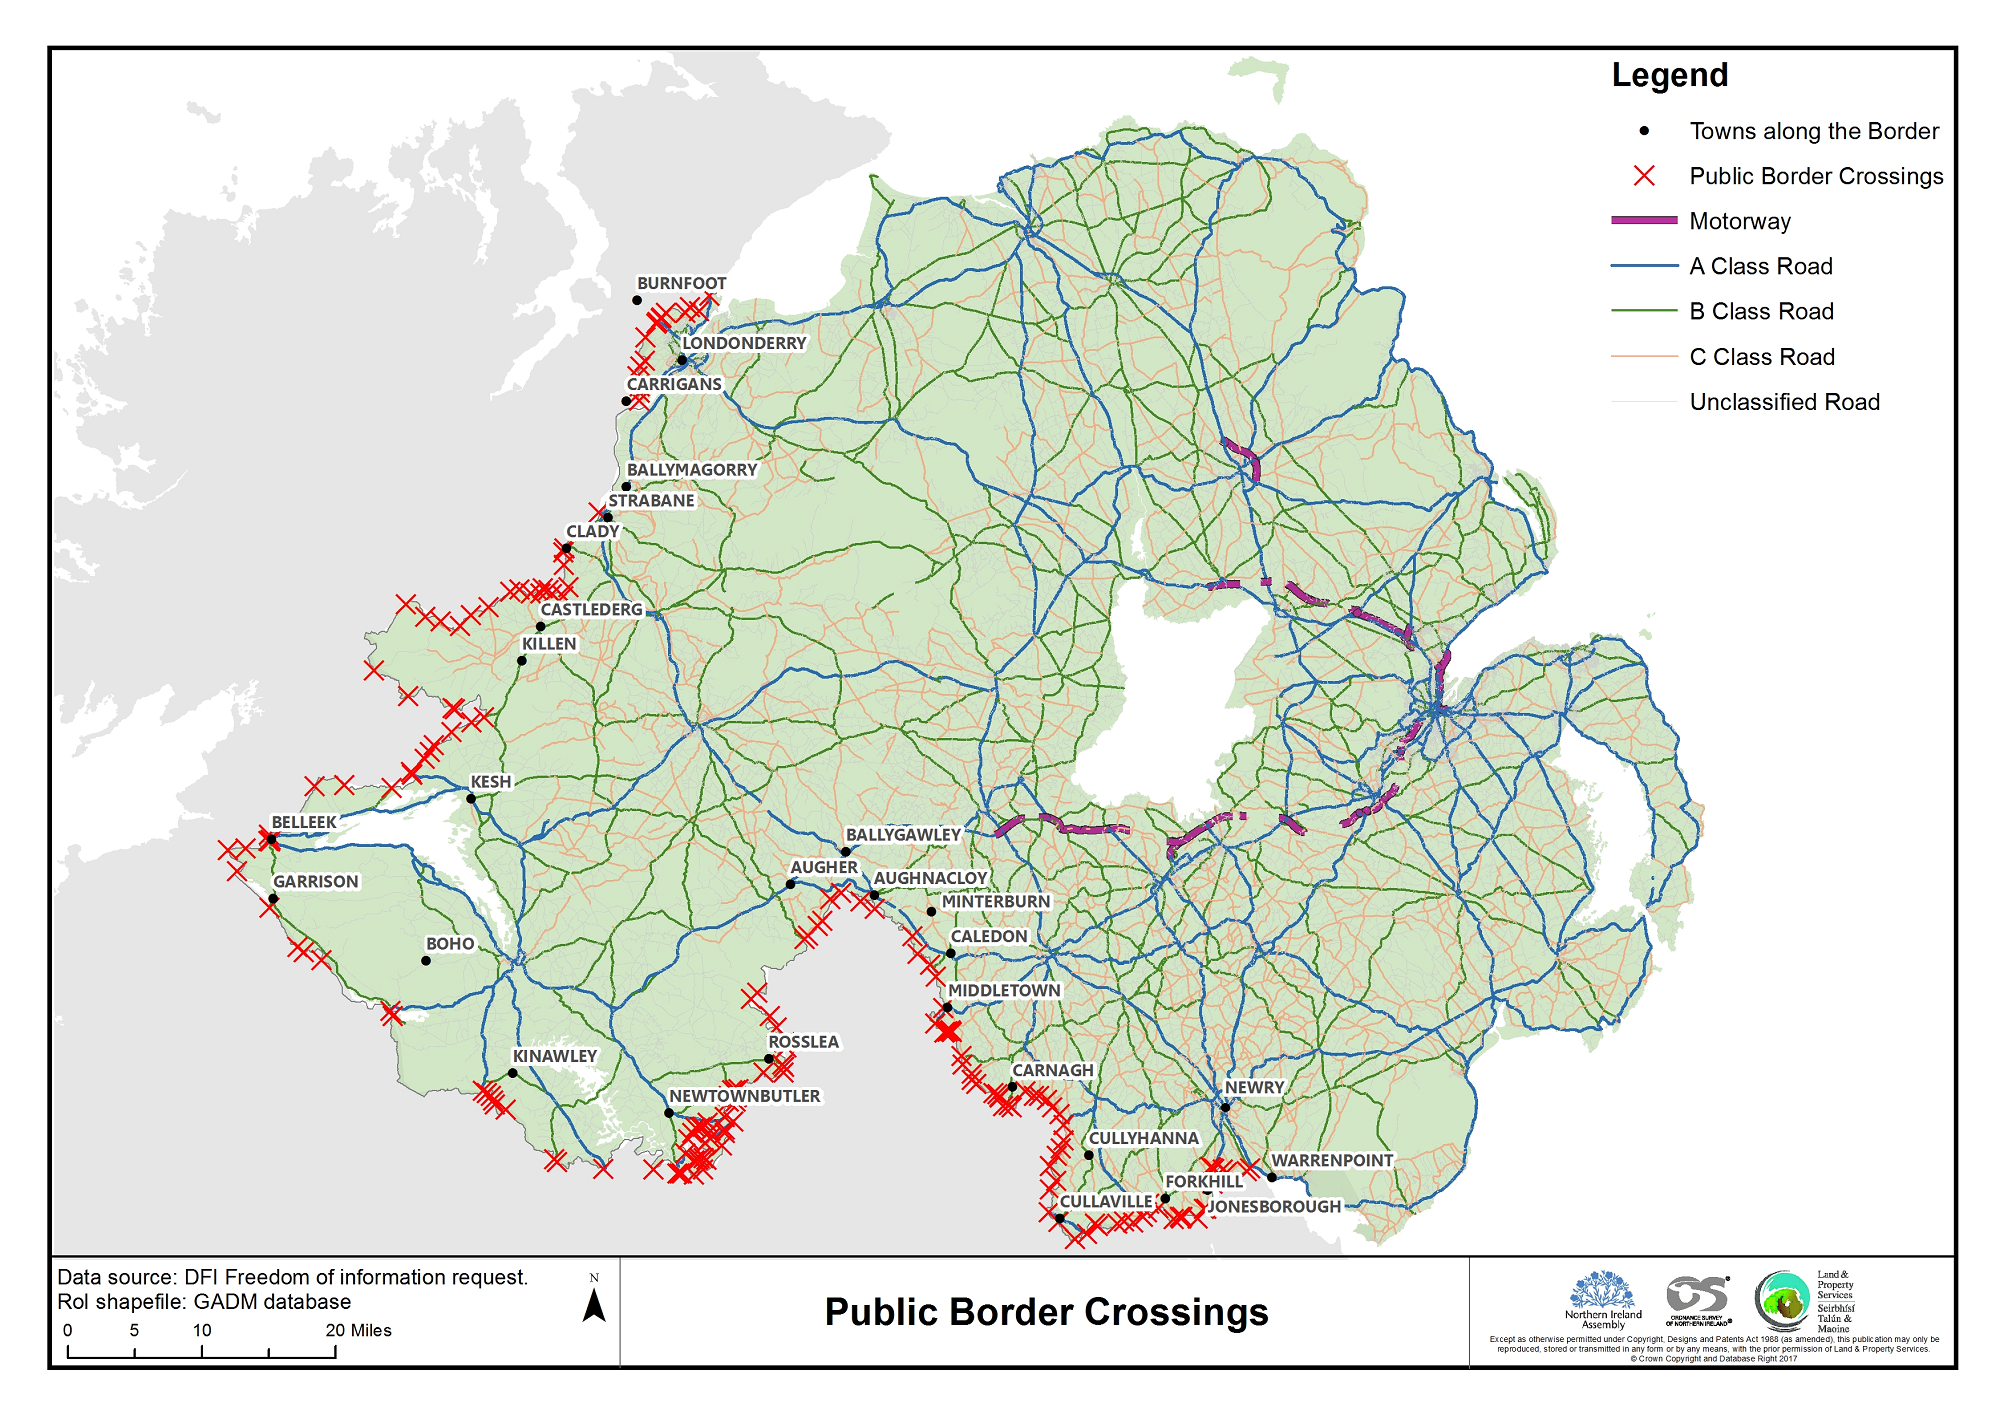
The border between NI and ROI stretches over 300 miles in length and has a high number of crossings. According to the Department for Infrastructure (DfI):
In total, there are 178 sections of the road network which cross the border. There are 195 border crossing points, taking into account one section may cross the border more than once and there may be other junctions from the south connecting to a northern road which itself doesn’t cross the border. 45 private crossing points have been identified using orthophotography however as these are not managed by DfI, it should be highlighted that this may not be an exhaustive list.
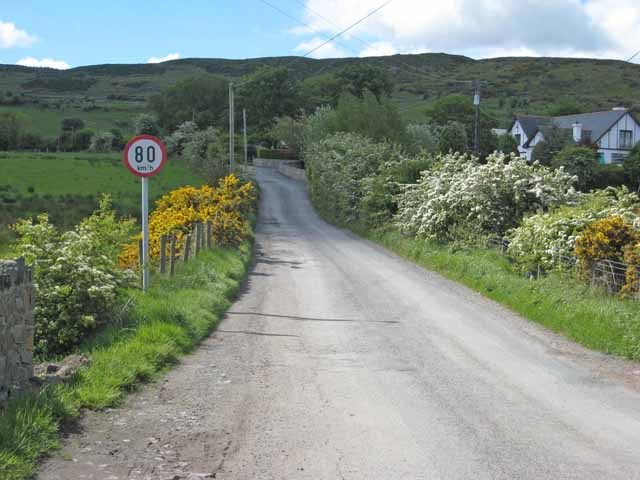
Table one provides a breakdown of the crossings by road class. This shows that not only is there no cross-border motorway, but the vast majority of crossings (80%) are either C-class or unclassified roads. These roads present drivers with a number of potential hazards including sweeping bends, variable topography, reduced visibility at junctions, slow moving vehicles and unpredictable interactions with vulnerable road users due to the lack of cycle lanes and footpaths.
| Road Class | Number of Crossings by Road Class | % of Crossings in each Road Class |
| A | 23 | 12% |
| B | 16 | 8% |
| C | 14 | 7% |
| U | 142 | 73% |
Rural roads
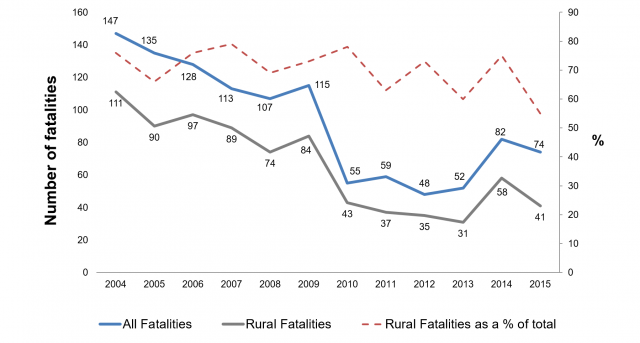
Rural roads, whilst having a lower frequency of RTCs than urban roads, consistently see more severe outcomes. Figure one shows fatal RTCs on all roads (left axis), and the percentage of those that have occurred on rural roads (right axis) in NI between 2004 and 2015. The total number of fatalities has reduced by 50% in that time, while fatalities on rural roads have reduced by 63%. The number of deaths on rural roads has fallen at a faster rate in this time although they continue to be more dangerous.
2015 was the first time in this period that rural fatalities accounted for less than 60% (55%) of total NI fatalities while as recently as 2014, 75% of RTC fatalities occurred on rural roads.
RTCs on the border: Recent trends
2012 saw the lowest ever number of road fatalities recorded in both NI (48) and ROI (162). Looking specifically at the border region (as shown in map one), figure two shows that between 2004 and 2012:
- The number of fatalities in ROI border counties fell from 75 to 30 (a drop of 60%), compared to a 56% reduction in non-border counties;
- In NI, fatalities in the border region fell from 67 to 16 (a drop of 76%), compared to 60% in non-border areas (see figure 2, below).
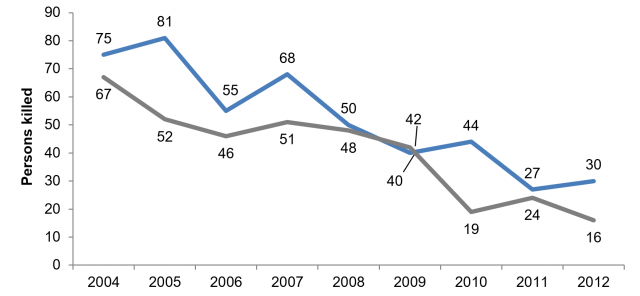
Figure three plots the rate of fatalities in the border areas of NI and ROI between 2004 and 2012 per 10,000 inhabitants. In 2004 the rate of fatal RTCs was 2.5 per 10,000 and 1.4 per 10,000 in ROI and NI respectively. By 2009, both regions recorded a much reduced rate of 0.8 and while these have fluctuated since, the rate of fatal RTCs in both regions remained below this level in 2012.
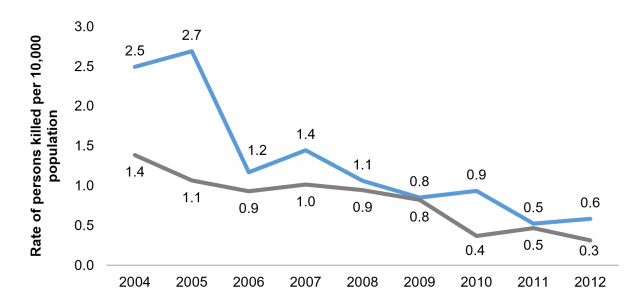
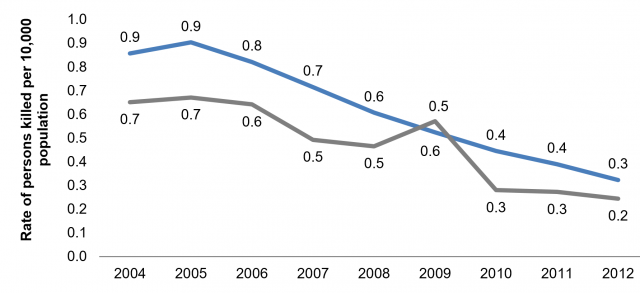
Figure four plots that rate of fatal RTCs in non-border areas. As is the case in border areas the rate has dropped significantly between 2004 and 2012. Comparing figures three and four we can see that in 2004 the fatality rate in NI’s border region was exactly double that of non-border areas while in 2012 there were only 0.1 more fatalities per 10,000 population. A similar trend can be observed in ROI.
Serious injury RTCs
The definition of ‘serious injury’ is broad and includes a wide range of injuries from a bone fracture to a severe life changing injury. Both jurisdictions use the same definition. While there is a lower fatality rate in NI compared to ROI, there would appear to be a significantly higher occurrence of serious injury RTCs in NI. In 2012, the figures suggest that there were almost three times the number of serious injury road traffic collisions in the NI border region (n=232) compared to the ROI border region (n=83). This difference in serious injury figures is worthy of further study.
Geographical comparison
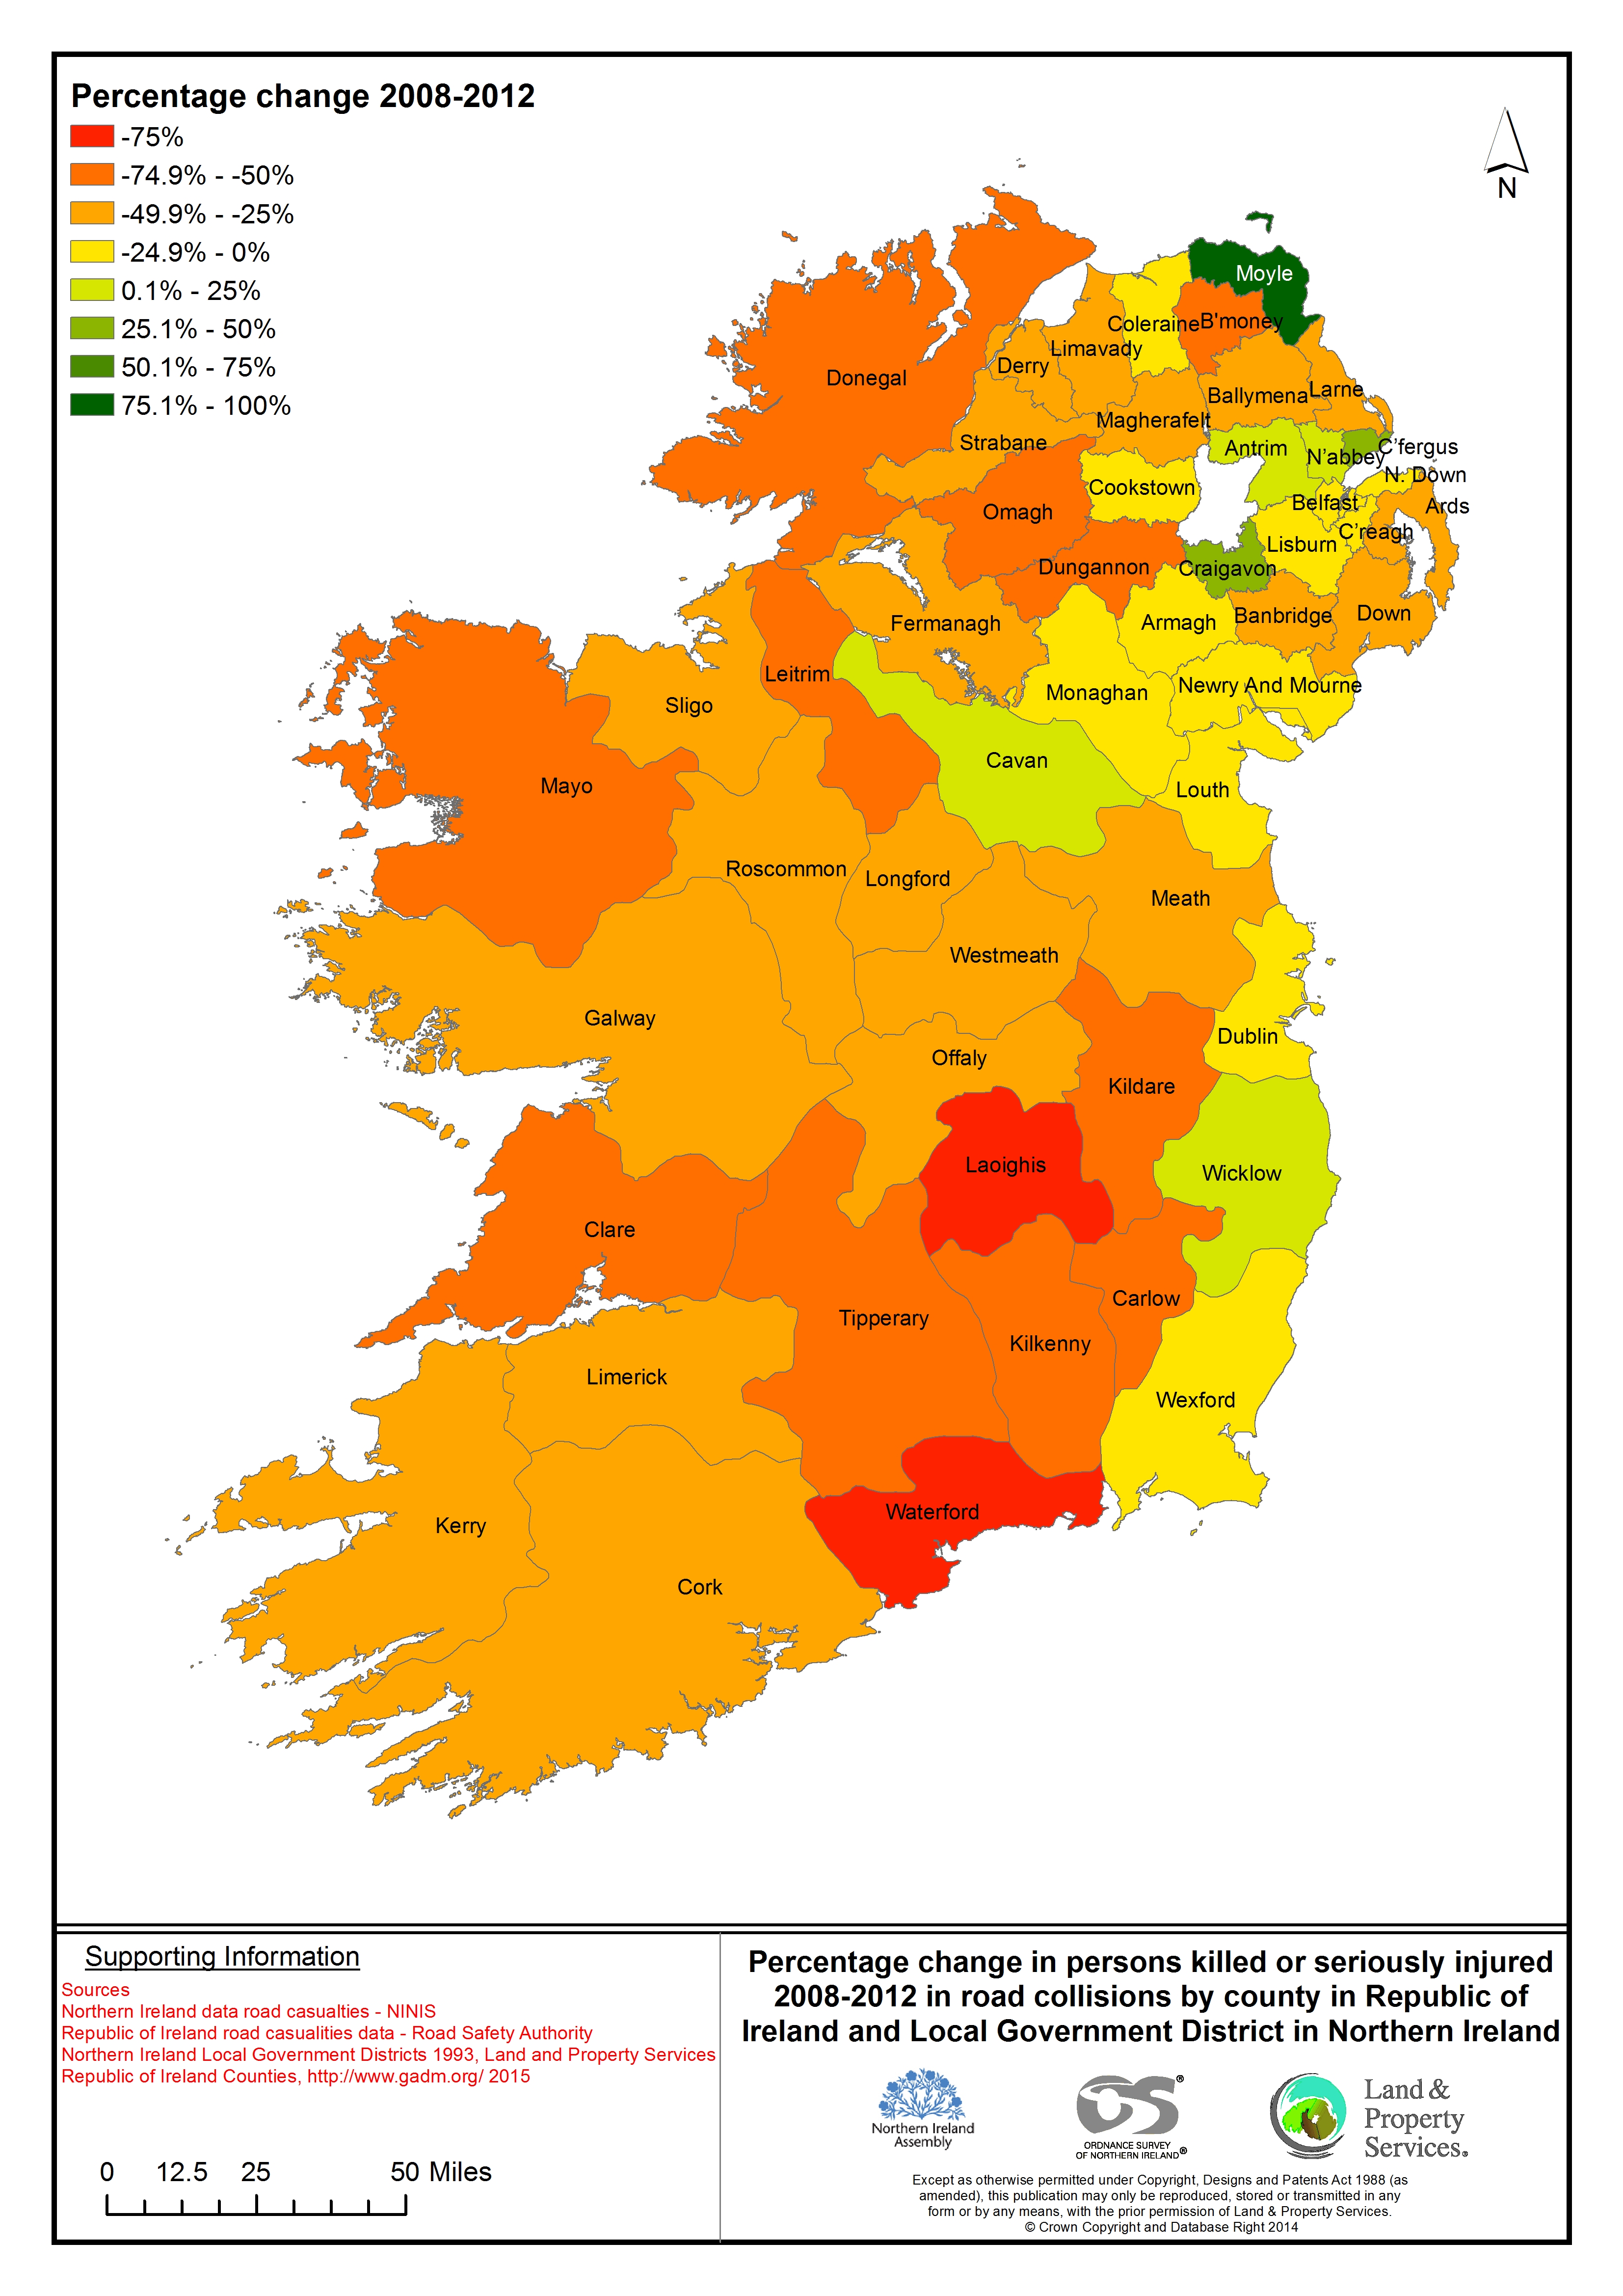
Table two ranks the county council and LGDs in ROI and NI respectively. This is according to the reduction recorded in terms of the number of persons killed or seriously injured in RTCs between 2008 and 2012.
Table 2: Number of persons killed or seriously injured in the border region in 2008 & 2012 with % change
| Killed | Seriously Injured | Killed or Seriously Injured | % change | ||||
| 2008 | 2012 | 2008 | 2012 | 2008 | 2012 | ||
| Leitrim | 5 | 0 | 5 | 4 | 10 | 4 | -60.0 |
| Donegal | 18 | 7 | 65 | 28 | 83 | 35 | -57.8 |
| Dungannon | 8 | 2 | 55 | 25 | 63 | 27 | -57.14 |
| Omagh | 7 | 4 | 55 | 25 | 62 | 29 | -53.23 |
| Fermanagh | 6 | 3 | 60 | 34 | 66 | 37 | -43.94 |
| Sligo | 7 | 4 | 14 | 8 | 21 | 12 | -42.9 |
| Limavady | 3 | 0 | 29 | 19 | 32 | 19 | -40.63 |
| Derry | 2 | 2 | 60 | 39 | 62 | 41 | -33.87 |
| Strabane | 4 | 0 | 19 | 17 | 23 | 17 | -26.09 |
| Newry & Mourne | 13 | 2 | 48 | 44 | 61 | 46 | -24.59 |
| Armagh | 5 | 3 | 30 | 29 | 35 | 32 | -8.57 |
| Monaghan | 5 | 2 | 10 | 12 | 15 | 14 | -6.7 |
| Louth | 7 | 7 | 20 | 19 | 27 | 26 | -3.7 |
| Cavan | 8 | 10 | 13 | 12 | 21 | 22 | 4.8 |
| Total | 98 | 46 | 483 | 315 | 581 | 361 | -38% |
Source: Road Safety Authority Ireland and PSNI Statistics Branch
While County Leitrim tops the table it has had the lowest number of fatal and serious RTCs in 2008 and 2012. County Donegal, and the Dungannon and Omagh LGDs, have seen the greatest reductions in fatal and serious RTCs between 2008 and 2012. There were also notable reductions in Fermanagh (-44%), Sligo (-43%), and Limavady (-34%). Each of these areas has seen significant reductions in the number of serious injury RTCs. Newry and Mourne, though, which has seen a huge reduction in fatalities between 2008 (13) and 2012 (2), has seen the number of serious injuries remain consistently high (48 in 2008 and 44 in 2012).
The improving road safety picture across the island of Ireland between 2008 and 2012 is presented in map two. Cavan stands out among the border counties as the only area to see an increase in KSIs. Along the north coast of NI, the Moyle LGD also stands out, having seen a massive spike in KSIs. This is a sparsely populated rural constituency that does have an above average rate of both fatal and serious RTCs. Over the period the KSI rate per 10,000 increased from 7.1 to 13.4.
Summary
The 2002 CAWT report highlighted an important issue whereby fatal and serious RTCs were more prevalent in the border regions of NI and ROI. While at first this was perceived as a by-product of the border itself, subsequent research showed other societal issues were to blame including attitudes of road users, the quality of the road infrastructure and higher levels of car dependency. There was also an acknowledgement from police that more could be done in terms of enforcement.
The data presented in this blog post shows that ten years on from the CAWT study there have been significant improvements to road safety in the border region, particularly in terms of the number of fatalities which have halved (n = 98 in 2008 to 46 in 2012). One area that remains a concern is the rate of serious injuries, particularly in NI. It is not clear exactly why this is and, because of this, the subject of serious injury road traffic collisions will be addressed in a separate, forthcoming blog article.