Northern Ireland (NI) receives a sizeable fiscal transfer from the United Kingdom (UK) Government. In other words, considerably more is spent on public services than is raised in revenue. NI therefore relies on taxpayers elsewhere in the UK. Fiscal transfers from national government to sub-national regions are commonplace; they are intended to help redress variances in local economic performance.
What is a fiscal transfer?
A ‘fiscal transfer’ may be required to fill a ‘fiscal deficit’, i.e. where public expenditure is higher than revenue generated. Generally speaking, a Government’s fiscal deficit results in money borrowed by the state to meet the difference between revenue and spending.
Scale of fiscal transfer to NI
Table 1 shows that the former Department of Finance and Personnel (DFP) estimated the fiscal transfer to NI was £9.2 billion in 2013-14, meaning NI spent £9.2 billion more on public services than it raised in revenue. From total NI expenditure of £24.1 billion in that year, this was a significant proportion; 38% was funded by UK taxpayers outside NI.

Trend in fiscal transfer
Table 2 shows the trend from 2009-10 to 2013-14. In nominal terms, i.e. not adjusted for inflation, the fiscal transfer decreased from £9.6 billion to £9.2 billion over the five years, but there was considerable fluctuation:

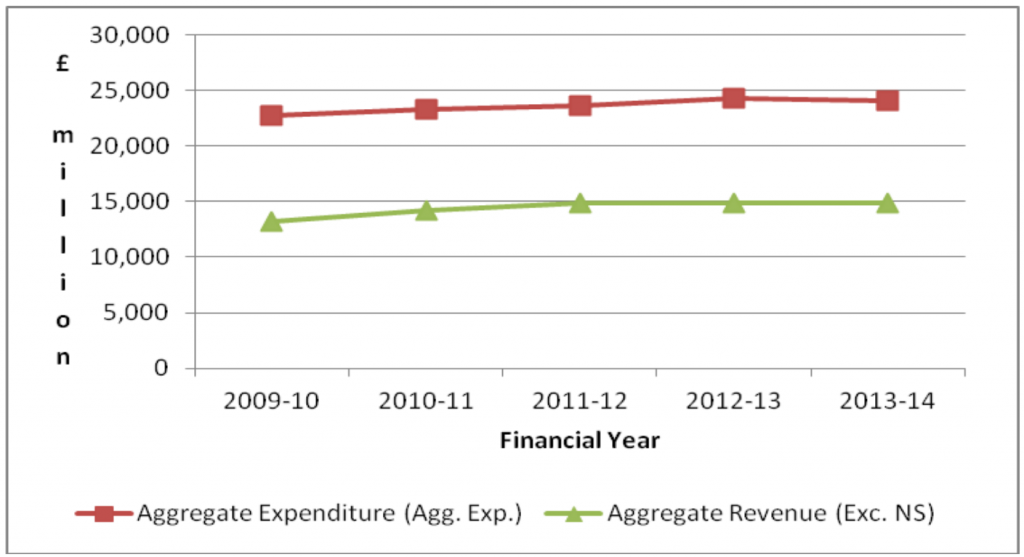
From 2009-10 to 20013-14, aggregate revenue grew 13% from £13,191 million, to £14,923 million in cash terms. Aggregate public expenditure grew 6% from £22,774 million, to £24,083 million. So over the period expenditure grew at a slower rate than revenue.
Figure 1 charts the aggregate revenue and expenditure trends over the five-year period 2009-2014.

Where do these figures come from?
DFP’s estimates of revenue generated in NI are – for the most part – just that: estimates compiled using proxy variables based on data provided by other government departments and various agencies including Her Majesty’s Revenue and Customs, and the Office for National Statistics (DFP, 2015, pages 46-7). This means actual, real data was unavailable and alternative data was used instead to help estimate a realistic figure. Commonly, the alternative data is the revenue generated in the UK as a whole and that apportioned to NI is based on relative population, or on an indicator of economic activity, such as productivity. Hence, like all estimates, DFP’s could be wrong. If it over-estimated revenue, then it could have made the fiscal transfer to NI appear smaller than it really was. Conversely, if it under-estimated revenue, then it could have made the fiscal transfer to NI appear larger than it really was.
On the expenditure side of the equation, DFP uses the Treasury’s Public Expenditure Statistical Analyses (PESA) data. Much PESA data is highly accurate, for example, pensions and other benefits payments can be directly attributed to individuals in a particular location because the paying authorities have the recipients’ addresses. This means that the total UK expenditure on, for example, Child Benefit, can be precisely mapped to the locations where the recipients live. In turn, this creates an accurate picture of the regional balance of such payments, making it easier to compare one region with another.
But for other expenditure lines, the picture may be less certain. For example, the PESA data shows expenditure in NI by UK Government departments: under the financial arrangements of current devolution, such expenditure is controlled and directed not by the Assembly, but by Westminster. A significant number of such expenditure lines attribute spending to NI based on population shares or other proxy variables. Hence, as explained earlier, those figures may not be totally accurate. If PESA overestimates the expenditure, the fiscal transfer will appear larger than it actually is, and vice versa.
What does this mean for NI?
DFP estimates therefore, that NI has received a fiscal transfer for more than a third of its public expenditure in recent years. This estimation is brought into sharper focus in the current context of the UK Government’s austerity programme, combined with the Executive’s restricted exercise of its available fiscal powers. Naturally questions arise about the Executive’s future approach to how it exercises its existing, and any possible future, fiscal powers. The extent of the deficit impacts on such decision-making.

