The fifth Assembly election since the return of devolution in 1998 took place on 5 May 2016. The DUP consolidated its position as the largest party in Northern Ireland with the return of its 38 Members, with the UUP and Alliance also ending up with the same number of seats as before. The nationalist parties, however, experienced reverses, with the loss of two seats by the SDLP and one by Sinn Féin. In this post, the first of two articles on Election 2016, the focus is on the candidates and voter turnout. Tomorrow, a second post will look at the results. These posts are largely based on a more detailed and comprehensive election report which can be viewed here.

History of Assembly Elections
The current Northern Ireland Assembly was established under the terms of the Belfast / Good Friday Agreement, with the first election held on 25 June 1998. Legislative powers and executive authority for the Northern Ireland Government Departments were devolved to the Assembly from 2 December 1999. Since devolution, the Assembly has been suspended on four occasions, with the last on 14 October 2002. Despite this, an election for the second session of the Assembly went ahead on 26 November 2003.
The Assembly remained suspended, however, after the second election. In 2006, the Northern Ireland (St Andrews Agreement) Act 2006 provided for a Transitional Assembly to take part in preparations for the restoration of devolved government. The Transitional Assembly helped to create the conditions for a third Assembly election, which took place on 7 March 2007. Restoration took place on 8 May 2007. The fourth Assembly election took place on 5 May 2011 and the fifth election occurred on 5 May 2016.
The Electoral System
The Single Transferable Vote (STV) system of proportional representation is used to elect Members of the Assembly. This system is also used in the Northern Ireland Local Government and European Parliament elections and in elections in the Republic of Ireland. STV has a number of advantages over the simple ‘first past the post’ system used in the Westminster elections:
- It increases voter choice (voters can vote for more than one candidate and can choose between candidates as well as between parties);
- It ensures that more voters have an effect on the outcome (over 80% of all valid votes are used in the determination of the six seats in each constituency); and
- It ensures an outcome that is more representative of the views of the electorate (the overall share of seats will better reflect overall share of the vote, i.e. voters will be proportionately represented).
The Constituencies
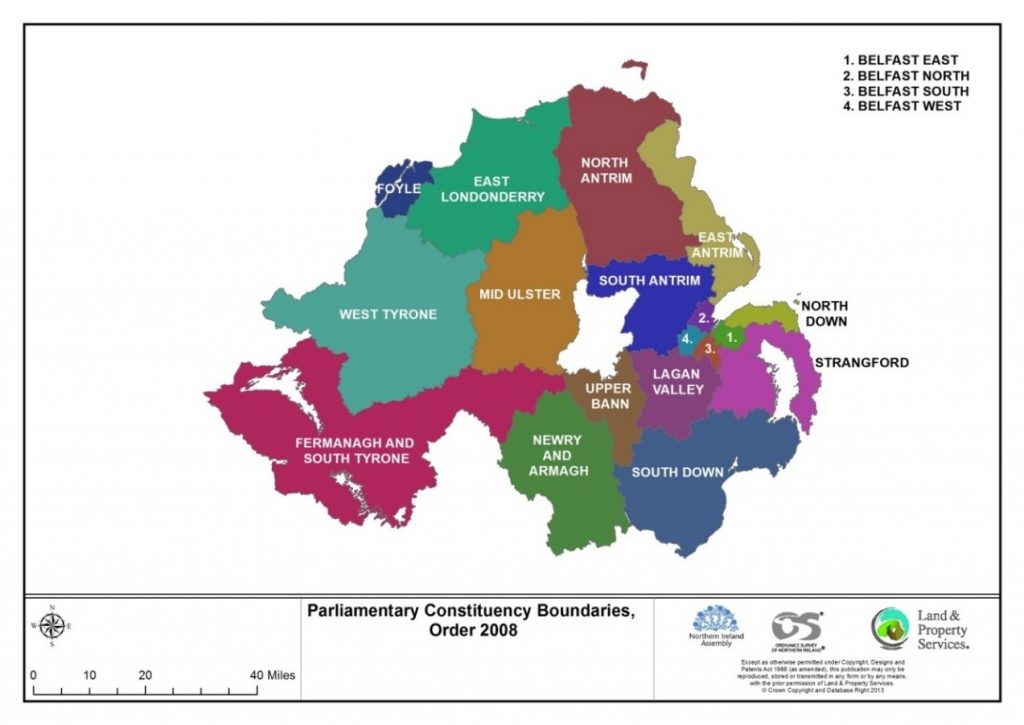
Currently, the 18 Westminster Parliamentary Constituencies (WPCs) are used for the Assembly elections (see Map 1 below). Six seats are allocated to each constituency, giving a total of 108 seats. Revised Parliamentary Constituency boundaries are due to be created by 2018, while the number of seats is scheduled to be reduced to 90 (five per constituency) in time for the 2021 election.

The Candidates
A total of 276 candidates stood for the 2016 election, compared with 218 in 2011, an increase of 27 per cent (Table 1). The DUP had the largest number of candidates (44), followed by Sinn Féin (39), UUP (33), SDLP (24), and Alliance (23). The Green Party fielded 18 candidates, followed by the TUV (15), UKIP (13), and the Conservatives (12). The number of female candidates doubled, from 38 in 2011 to 76 in 2016, representing an increase of 10 percentage points, from 17 per cent in 2011 to 27 per cent in 2016. Of the main parties, Sinn Féin had the largest percentage of female candidates (38%), followed by the Alliance Party (35%), SDLP (33%), UUP (21%) and the DUP (18%).
Male |
Female |
Total |
% Female |
||
| Democratic Unionist Party (DUP) | 36 | 8 | 44 | 18.2 | |
| Sinn Féin (SF) | 24 | 15 | 39 | 38.5 | |
| Ulster Unionist Party (UUP) | 26 | 7 | 33 | 21.2 | |
| Social Democratic and Labour Party (SDLP) | 16 | 8 | 24 | 33.3 | |
| Alliance Party (APNI) | 15 | 8 | 23 | 34.8 | |
| Green Party | 9 | 9 | 18 | 50.0 | |
| Traditional Unionist Voice (TUV) | 13 | 2 | 15 | 13.3 | |
| UK Independence Party (UKIP) | 12 | 1 | 13 | 7.7 | |
| Conservative | 12 | 0 | 12 | ||
| NI Labour Representation Committee | 4 | 4 | 8 | 50.0 | |
| Progressive Unionist Party (PUP) | 5 | 1 | 6 | 16.7 | |
| Cannabis is Safer than Alcohol | 4 | 0 | 4 | 50.0 | |
| The Workers Party | 2 | 2 | 4 | ||
| Cross Community Labour Alliance | 2 | 1 | 3 | 33.3 | |
| People before Profit Alliance (PBPA) | 2 | 1 | 3 | 33.3 | |
| Animal Welfare Party | 0 | 1 | 1 | 100.0 | |
| Democracy First | 1 | 0 | 1 | ||
| Northern Ireland First | 1 | 0 | 1 | ||
| South Belfast Unionists | 1 | 0 | 1 | ||
| Independents | 15 | 8 | 23 | 34.8 | |
| Totals | 200 | 76 | 276 | 27.5 |
Table 1: 2016 Election Candidates by Party and Gender
Turnout
Turnout is calculated by taking the total number of votes cast (including spoilt votes) and dividing by the eligible electorate. The total eligible electorate in May 2016 was 1,281,595 (compared with 1,210,009 in 2011). The official turnout was 703,744, or 54.9 per cent of the eligible electorate. Turnout was highest in Fermanagh and South Tyrone (64.6%) and lowest in North Down (49.6%).
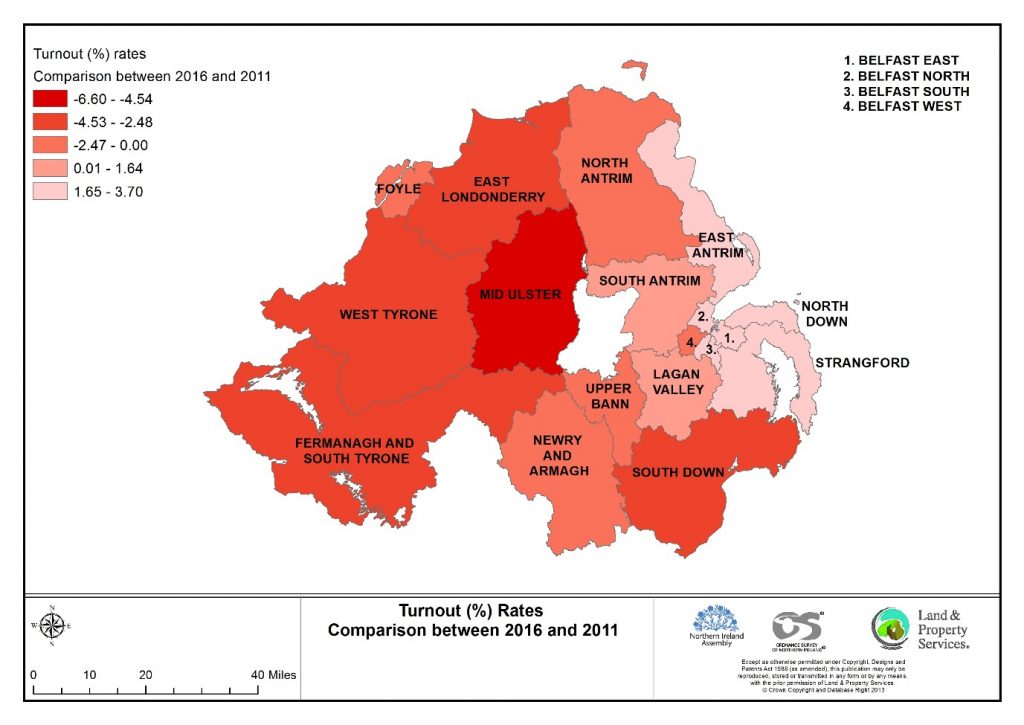
Compared with the previous election, voter turnout fell from 55.7 per cent in 2011 to 54.9 per cent in 2016, a fall of 0.8 of a percentage point. While the overall rate was down, turnout actually increased in eight constituencies and fell in the remaining ten. In broad terms, turnout rose in the east of Northern Ireland, particularly in Belfast and the Greater Belfast area, and fell in the rest of Northern Ireland, notably the West and South. The largest falls were recorded in Mid Ulster (6.6 percentage points), Fermanagh and South Tyrone (4.4) and West Tyrone (4.1), while the highest increases were observed in North Down (3.7 percentage points) and Belfast East (3.6).
Map 2 shows the difference in turnout between 2011 and 2016. The darker shaded areas show the constituencies where the fall in turnout was most marked, and indicates that turnout generally fell in those constituencies with a nationalist majority, and rose in constituencies with a unionist orientation.

Turnout has been falling steadily since the first Assembly election in 1998 (Table 2). An overall figure of 70 per cent was recorded in 1998, which fell at every subsequent election to a low of 54.9 per cent in 2016. While turnout has fallen in all constituencies since the high point of 1998, the decline has been most marked in nationalist-dominated constituencies. In West Tyrone, for example, turnout fell from 79.4 per cent in 1998 to 59.9 per cent in 2016, a drop of almost 20 percentage points. Falls of a similar magnitude have occurred in Mid Ulster (26 percentage points); South Down (20); and Newry and Armagh (18).
| Constituency | 1998
% |
2003
% |
2007
% |
2011
% |
2016
% |
|
| Belfast East | 66.6 | 60.7 | 60.0 | 53.6 | 57.2 | |
| Belfast North | 67.3 | 62.3 | 60.9 | 50.3 | 52.5 | |
| Belfast South | 67.4 | 62.6 | 62.4 | 52.4 | 54.3 | |
| Belfast West | 70.5 | 65.9 | 67.4 | 57.9 | 57.8 | |
| East Antrim | 60.9 | 56.5 | 53.5 | 47.8 | 51.0 | |
| East Londonderry | 67.7 | 61.8 | 60.9 | 54.1 | 50.8 | |
| Fermanagh and South Tyrone | 79.4 | 72.9 | 71.2 | 69.0 | 64.6 | |
| Foyle | 72.0 | 63.5 | 63.9 | 57.8 | 56.0 | |
| Lagan Valley | 65.7 | 61.4 | 60.0 | 53.1 | 53.2 | |
| Mid Ulster | 84.4 | 74.9 | 73.1 | 65.4 | 58.8 | |
| Newry and Armagh | 77.3 | 70.2 | 70.8 | 61.3 | 59.3 | |
| North Antrim | 69.0 | 63.3 | 61.3 | 54.8 | 52.9 | |
| North Down | 60.2 | 54.5 | 53.8 | 45.9 | 49.6 | |
| South Antrim | 64.2 | 59.5 | 58.6 | 50.1 | 51.0 | |
| South Down | 73.7 | 65.6 | 65.0 | 58.1 | 53.8 | |
| Strangford | 61.6 | 57.1 | 54.5 | 48.6 | 50.3 | |
| Upper Bann | 72.3 | 64.2 | 61.1 | 55.3 | 54.4 | |
| West Tyrone | 79.4 | 73.2 | 71.7 | 64.0 | 59.9 | |
| Northern Ireland | 70.0 | 64.0 | 62.9 | 55.7 | 54.9 |
Table 2: Turnout at Assembly Elections, 1998 – 2016
Tomorrow, the second post in the Election 2016 series will focus on the results and transfers.

