Overall public spending per capita is higher in Northern Ireland than in any of the other UK regions. However, the proportion which is spent on transport is lower.

Transport infrastructure as an economic driver
High quality transport infrastructure is a critical determinant of a country’s economic competitiveness and while the UK ranks relatively highly in the global infrastructure league tables it falls short of a number of countries of similar size and wealth. Comparisons with other EU and OECD countries show that the UK’s road infrastructure is in need of particular attention as it has fallen below the standards required to keep the UK competitive.
The role of government in delivering high quality infrastructure
Broadly speaking the role of most national governments with regards to transport is to establish policy, set the legislative framework and determine funding priorities. They will often have responsibility for ownership and regulation of national networks such as strategic road and railway networks. However, typically, within the UK and wider EU, most powers relating to local transport are held by local or metropolitan authorities, including the delivery of public transport services, through for example, contracting, franchising or licensing agreements or direct ownership; maintenance of local road networks; pedestrian and cycling facilities; public lighting and bus infrastructure. In contrast, all of these transport functions are highly centralised within NI with the Department for Infrastructure (DfI) responsible for all aspects of planning, delivery and financing of transport.
Transport expenditure in the UK regions
The purpose of this article is to identify, through analysis of recent expenditure, the level of priority afforded to transport infrastructure investment in Northern Ireland, compared to the other UK regions. The main authoritative source of public spending across different types of services and across different UK regions is the HM Treasury’s Public Expenditure Statistical Analyses (PESA).
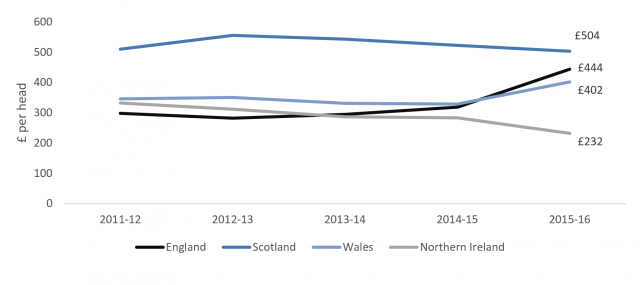
The PESA data, presented in table one, shows that in 2015/16 transport spend in Northern Ireland, as a proportion of overall expenditure, was around half that of Wales and lower again than in Scotland and England.
| 2014/15 | 2015/16 | |
| England | 3.4% | 5% |
| Scotland | 5.0% | 4.8% |
| Wales | 3.2% | 4% |
| Northern Ireland | 2.5% | 2.1% |
| Table 1: Percentage (%) of total identifiable expenditure attributed to transport in GB and NI 2014/15 and 2015/16 (Source: PESA [2016]) |
On a per capita basis the Scottish Government has consistently spent more on transport than any of the other UK regions, indeed Scotland’s spend per capita was more than twice as high as NI’s in 2015/16 at £504, compared to £232.
Roads
Whilst the DfI is responsible for the entire NI road network, in GB responsibilities are split between national (strategic roads) and local government (local roads): Highways England (formerly the Highways Agency) is a government-owned company charged with operating, maintaining and improving England’s strategic road network i.e. its motorways and major A roads. Transport Scotland and the Welsh Assembly have similar responsibilities as regards to their national trunk road networks with local roads in each region managed by the relevant local authority.
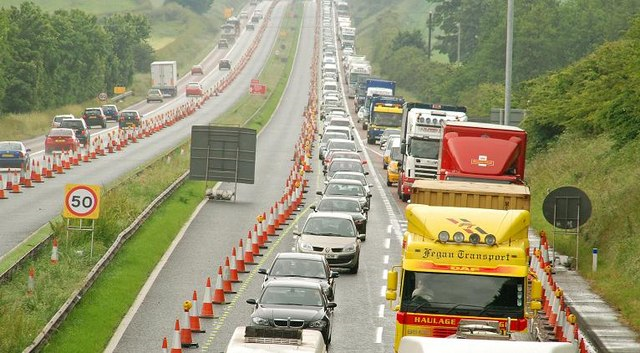
The Department for Regional Development (DRD; now superseded by the Department for Infrastructure) had been criticised by the NI Audit Office which pointed to a disparity in funding between roads and public transport. However, PESA data shows that on a per capita basis NI spends less per capita (£131 in 2014/15) on roads (local and national combined) than each of the other UK jurisdictions.
| 2010-11 outturn | 2011-12 outturn | 2012-13 outturn | 2013-14 outturn | 2014-15 outturn | ||
| £ per head | ||||||
| England | National roads | 105 | 85 | 115 | 107 | 104 |
| Local roads | 133 | 128 | 130 | 130 | 120 | |
| Scotland | National roads | 89 | 65 | 70 | 80 | 80 |
| Local roads | 114 | 109 | 118 | 94 | 83 | |
| Wales | National roads | 20 | 11 | 12 | 8 | 7 |
| Local roads | 272 | 186 | 184 | 202 | 189 | |
| Northern Ireland | National roads | 52 | 46 | 38 | 43 | 52 |
| Local roads | 82 | 71 | 64 | 68 | 79 | |
| Table 2: Per capita spend on roads (national and local) in the UK, by region, 2010-11 to 2014-15 |
The Audit Office’s analysis focused on expenditure between 2002/03 and 2011/12, finding there was a 70/28% split in funding between the two despite there being a targeted split of 62:35%, as outlined in the 2002 Regional Transportation Strategy (RTS).
The pattern of expenditure in GB is much more balanced, however factors including the extensive rail network in GB and the costs associated with maintaining and operating it contribute significantly to the relatively high levels of public transport expenditure. In stark contrast the lack of a comprehensive rail network in NI means that all freight and the vast majority of public transport traffic (buses) use roads which ‘need significant investment to build regional connectivity and address the legacy of under investment over previous decades.’BusesDespite having a deregulated bus market, dominated by large private companies, in GB significant public funds continue to go into the industry through various grants and subsidies which are set out in table three.
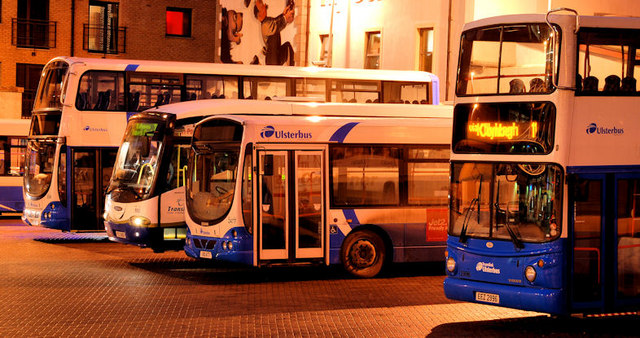
These figures, taken from a range of official sources (the sources for which are linked), show that subsidies/support make up a much higher proportion of total operator revenue in GB than they do in NI, where 75% of total bus operating revenue in 2014/15 came from fare paying passengers. Translink receives no Bus Service Operators Grant (BSOG), or fuel duty rebate, as the equivalent programme was previously known in NI before its withdrawal in 2013. Nor does Translink receive route support, on the understanding that loss-making services are effectively cross-subsidised by profitable ones.The relatively low level of subsidy which Translink receives can be viewed in two ways; from the point of view of public expenditure it is a positive that a nationalised public transport company operates with minimal subvention. However, low levels of subsidy inevitably put pressure on services and fares which together ‘undermine’ attempts to increase public transport usage. So rather than growing public transport use, between 2011/12 and 2015/16 there has been a reduction in service levels, equivalent to 0.9 million miles (from 34.3 to 33.4 million miles) whilst at the same time fares have increased by 5% in 2015 and by a further 1.6% in 2017. Over the same period passenger journeys on Ulsterbus have fallen from 40.6 million journeys in 2011/12 to 38.8 million in 2015/16 or 4.4%, whilst there has been a modest increase in Metro journeys (2%).Subsidy levels reflect the contrasting nature of the operating environments; whereas the unregulated bus companies in GB can choose whether or not to operate on certain routes on the basis of profitability, Translink must, while remaining solvent, operate services on loss-making routes, such as those to rural areas. This is a critical point, and one which poses a clear policy question; does the NI Executive want to increase public transport usage and realise a modal shift from car to public transport, significant enough to have an impact on issues such as congestion and air quality? If yes, then full account of the impacts that spending has on service quality, frequency, price and ultimately public transport usage will need to be taken.Conclusions Whilst there is a disproportionate split between road and public transport expenditure in Northern Ireland, NI as a region spends less on both roads and public transport, per capita, than each of the other UK jurisdictions. This suggests that rather than roads being prioritised, there is a general lack of resources allocated to transport which has an impact on all aspects of service delivery, be it road maintenance, delivery of new and strategically important schemes, fare increases on passenger transport and falling passenger numbers.
1 Operating revenue includes BSOG, concessionary fare reimbursement, contracts, other public support to passenger fare receipts.2 Some totals may not sum due to rounding; for full references, see a previous research paper on this subject.3 Revenue support only.
| Planned Expenditure £m
(2002-03 Prices) |
Planned Share of funding
% |
Actual Expenditure £m
(2002-03 Prices) |
Actual Share of funding
% |
||
| Roads | 2,176.1 | 62.2 | 2,737.6 | 70.3 | |
| Public Transport | 1,227.4 | 35.0 | 1,103.5 | 28.4 | |
| Walk/Cycle | 86.5 | 2.5 | 50.2 | 1.3 | |
| All/Other | 10.0 | 0.3 | 0.6 | 0 | |
| Total | 3,500 | 100 | 3,891.9 | 100 | |
| Table 3: Regional Transportation Strategy – Planned/Actual Expenditure (2002/03 to 2011/12) (Source: NIAO) | |||||
| England | Scotland | Wales | Great Britain | Northern Ireland | |
| Bus Operating Revenue1 | £5,593m | £648m | £186m | £6,427m | £178m |
| Passenger Revenue | £3,314m | £357m | £88.5m | £3,759.5m | £135m |
| As a percentage of total (%) | 59% | 55% | 48% | 58% | 75% |
| Passenger Journeys | 4,648m | 416m | 101m | 5,165m | 66.9m |
| Of which concessionary | 1,570m (34%) | 148m (36%) | 47m (47%) | 1,767m (34%) | 22 (33%) |
| BSOG Total | £251m | £51m | – | £302m | – |
| Per Passenger Journey | £0.5 | £0.12 | – | £0.5 | – |
| Concessionary Travel | £1,054m | £190m | £70m | £1,314m | £42.9m |
| Per Passenger Journey | £0.22p | £0.46 | £0.69 | £0.25 | £0.64 |
| Tendered Services | £993m | £57m | £24.9m | £1,071m | – |
| Per Passenger Journey | £0.21 | £0.14 | £0.25 | £0.21 | – |
| All Government Support PPJ3 | £0.47 | £0.72 | £0.94 | £0.42 | £0.64 |
| Table 4: Comparison of bus operator revenue sources in GB and Northern Ireland 2014-152 |