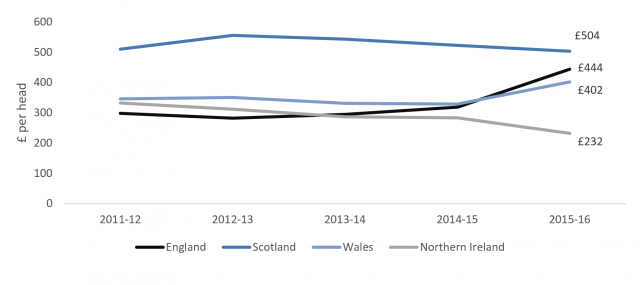
Figure 1_Identifiable expenditure on transport per capita 2011-12 to 2015-16
Reading Time: < 1 minute
Contact
Research and Information Service
Northern Ireland Assembly
Ballymiscaw
Stormont
Belfast
BT4 3XX
Phone: 028 9041 8320
Subscribe
Find out how to subscribe to this blog and receive notifications of new posts by email.
Please read our privacy notice to see how we handle your data before subscribing to the blog.
Links
- About our blog
- Blog archive (All blogs before May 2022)
- Northern Ireland Assembly website
- Research and Information Service (RaISe)
- Research Publications
- Knowledge Exchange Seminar Series (KESS)
- Research Matters Cookie Statement and Privacy Notice
- Accessibility Statement
- Northern Ireland Assembly Commission’s copyright policy


