The Westminster general election of 8 June 2017 resulted in a ‘hung parliament’, with the Conservatives as the largest party but without an overall majority. The result was: Conservative (318), Labour (262), SNP (35), Liberal Democrats (12), DUP (10) and Others (13). The Labour vote surged by over 3.5 million (38%), from 9.347 million in 2015 to 12.878 million in 2017. The Conservatives received 42.4% of the vote, while the Labour share rose from 30.4% in 2015 to 40.0% in 2017, an increase of 9.6 percentage points. Locally, the two largest parties (DUP and Sinn Féin) dominated the election, mainly at the expense of the three smaller parties (UUP, SDLP and Alliance). This post reviews the general election of 2017 in Northern Ireland; it follows a recently published research paper on the election results.

The candidates
In Northern Ireland, a total of 109 candidates stood for election, compared with 138 in May 2015, a fall of 21%. The number of female candidates rose from 33 in 2015 to 36 in 2017, which increased the proportion of women from a quarter (24%) in 2015 to a third (33%) in 2017.
Turnout
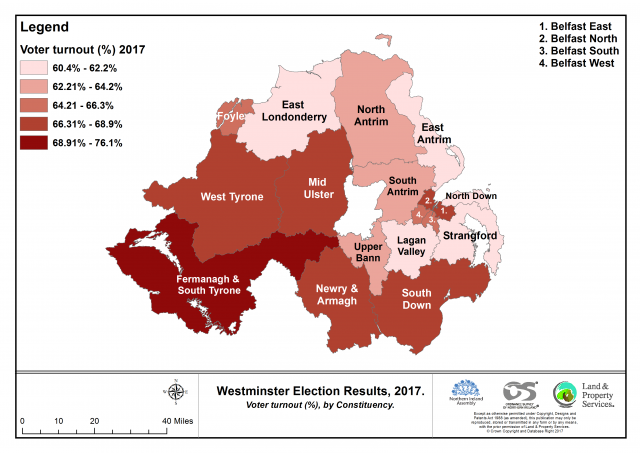
The total eligible electorate was 1,242,698 (compared with 1,236,765 in May 2015), a rise of 5,933 (0.5%). The total number of votes polled was 815,260, up from 722,904 in 2015, representing an increase of 92,356 votes (12.8%) compared with the May 2015 parliamentary election. The official turnout [1] was 65.6% of the eligible electorate, an increase of 7.1 percentage points [2] on the May 2015 figure (58.5%).
Turnout increased significantly in every constituency and was the highest recorded since 2005. The increase was especially notable in Foyle (12 percentage points higher), South Down (10.3), East Londonderry (9.4) and South and North Antrim (8.9 and 8.7 percentage points respectively). Even in North Down, which traditionally records the lowest turnout, the 2017 figure (61.0%) was almost five percentage points higher than in May 2015 (56.1%).

Overall results
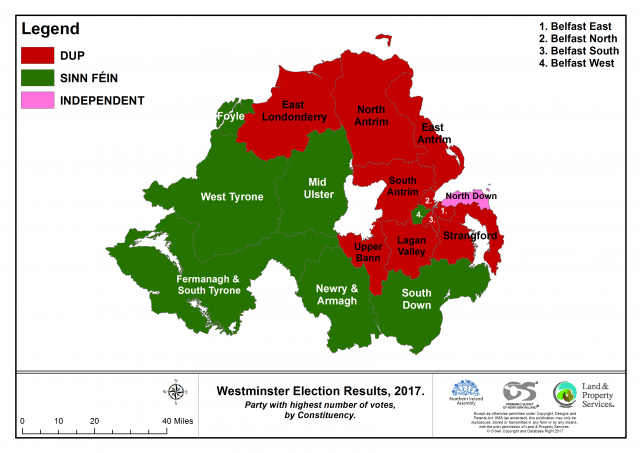
Table 1 presents a summary of the results of the 2017 general election in Northern Ireland, while Chart 2 illustrates the election results by constituency. The DUP won 10 seats, a gain of two, while Sinn Féin finished with seven, a gain of three. In contrast, the SDLP lost three seats (one to the DUP and two to Sinn Féin), while the UUP suffered two losses (one to DUP and one to Sinn Féin).
| Party | Seats | +/- | Valid Votes | Vote Share (%) | +/- (pp) |
| DUP | 10 | +2 | 292,316 | 36.0 | +10.3 |
| Sinn Féin | 7 | +3 | 238,915 | 29.4 | +4.9 |
| SDLP | 0 | -3 | 95,419 | 11.7 | -2.2 |
| UUP | 0 | -2 | 83,280 | 10.3 | -5.8 |
| Alliance Party | 0 | 0 | 64,553 | 7.9 | -0.6 |
| Green | 0 | 0 | 7,452 | 0.9 | 0.0 |
| TUV | 0 | 0 | 3,282 | 0.4 | -1.9 |
| Others | 1 | 0 | 26,966 | 3.3 | -1.8 |
The electoral map in Chart 2 neatly illustrates the electoral divide in Northern Ireland, with the DUP the dominant party in the North and East of Northern Ireland, while Sinn Féin is prominent in the South and West. The binary nature of a ‘first past the post’ voting system tends to exacerbate these differences.

Compared with 2015, and in line with the increased turnout, three of the five main parties recorded an increase in the number of votes cast. The DUP added an additional 108,000 votes to their tally, a rise of 59 per cent, while Sinn Féin gained nearly 63,000 extra votes, an increase of 36%. The Alliance Party recorded a modest upturn in their performance (3,000 votes, 4.9%). In contrast, the UUP vote fell by nearly 32,000 (28%) and the SDLP vote declined by 4,400 (4.4%).

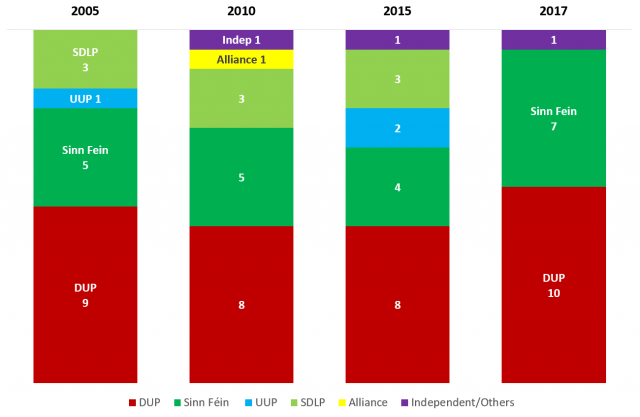
Chart 3 illustrates the results of the last four Westminster elections, and highlights the declining electoral fortunes of the SDLP and UUP. In May 2015, both parties accounted for five of the 18 seats, all of which were lost to the ‘big two’ in June 2017.
Individual party performance
- The Democratic Unionist Party (10 seats) returned to Westminster with two new Members, having gained South Antrim from the UUP and Belfast South from the SDLP. The party’s share of the vote increased by over 10 percentage points, from 25.7% in 2015 to 36.0% in 2017.
- Sinn Féin (7 seats) gained three seats, and its share of the vote rose by 4.9 percentage points. The party gained Fermanagh and South Tyrone at the expense of the UUP, and Foyle and South Down from the SDLP.
- The SDLP lost all its three seats and the party’s share of the vote fell by 2.2 percentage points, from 13.9% in 2015 to 11.7%.
- Similarly, the UUP lost both of its two seats and its vote share dropped from 16% to 10.3%, a fall of 5.7 percentage points.
- The Alliance Party failed to retake Belfast East, and their overall share of the vote declined marginally by 0.7 percentage points.
- There was one seat won by an Independent (Sylvia Hermon in North Down).
Women in the 2017 general election
There were 36 female candidates in Northern Ireland for the election (33%) and four female MPs (22.2%) were elected on 8 June 2017. Sinn Féin has two female Members, followed by the DUP with one, and an Independent Member (Sylvia Hermon, North Down). The Northern Ireland figures compare with Dáil Éireann, where 22% of TDs are female (February 2016 election). The National Assembly for Wales has the highest percentage of women representatives in UK parliaments (41.7%), followed by the Scottish Parliament (34.9%) and the House of Commons (31.8%).
Summary
The Westminster general election of 8 June 2017 resulted in a ‘hung parliament’, with the Conservatives as the largest party but without an overall majority. In Northern Ireland, the two main parties (DUP and Sinn Féin) had a successful poll, with both recording their largest ever vote in a Westminster election. The DUP, in particular, had a noteworthy performance, gaining two seats and increasing their vote count by 108,000, 59% higher than in 2015. Sinn Féin also performed well, with a 36% increase in their vote (62,700) reflected in an additional three seats. The UUP and SDLP lost all their five seats to their larger rivals. The Alliance Party saw a small rise in their overall vote (3,000) but failed to gain any seats.
[1] Turnout is calculated by taking the total number of votes cast (including invalid votes) and dividing by the eligible electorate.
[2] Percentage points refer to the difference between two percentages, e.g. the difference between 40% and 50% is 10 percentage points.

