Research Matters
A blog from the Northern Ireland Assembly Research and Information Service
Search
Topics
Academic Engagement
Agriculture and Environment
Agriculture
Energy
Environment
Fisheries
Rural Affairs
Economy and Finance
Economy
Employment and Labour Market
Energy
Enterprise and Investment
Finance
Research and Innovation
Education and Skills
Education
Higher and Further Education
Research and Innovation
Skills and Training
Governance
Academic Engagement
Brexit
Democracy and Government
Justice
Planning
Statistics and GIS
Health and Society
Children and Families
Community Relations
Culture and Sport
Equality
Health and Social Care
Housing
Immigration
Third Sector
Welfare
Infrastructure
Energy
Infrastructure
Transport
Water
Data Visualisations
Constituency Profiles
About Us
Subscribe
Research Matters
Topics
Academic Engagement
Agriculture and Environment
Agriculture
Energy
Environment
Fisheries
Rural Affairs
Economy and Finance
Economy
Employment and Labour Market
Energy
Enterprise and Investment
Finance
Research and Innovation
Education and Skills
Education
Higher and Further Education
Research and Innovation
Skills and Training
Governance
Academic Engagement
Brexit
Democracy and Government
Justice
Planning
Statistics and GIS
Health and Society
Children and Families
Community Relations
Culture and Sport
Equality
Health and Social Care
Housing
Immigration
Third Sector
Welfare
Infrastructure
Energy
Infrastructure
Transport
Water
Data Visualisations
Constituency Profiles
About Us
Subscribe
Search
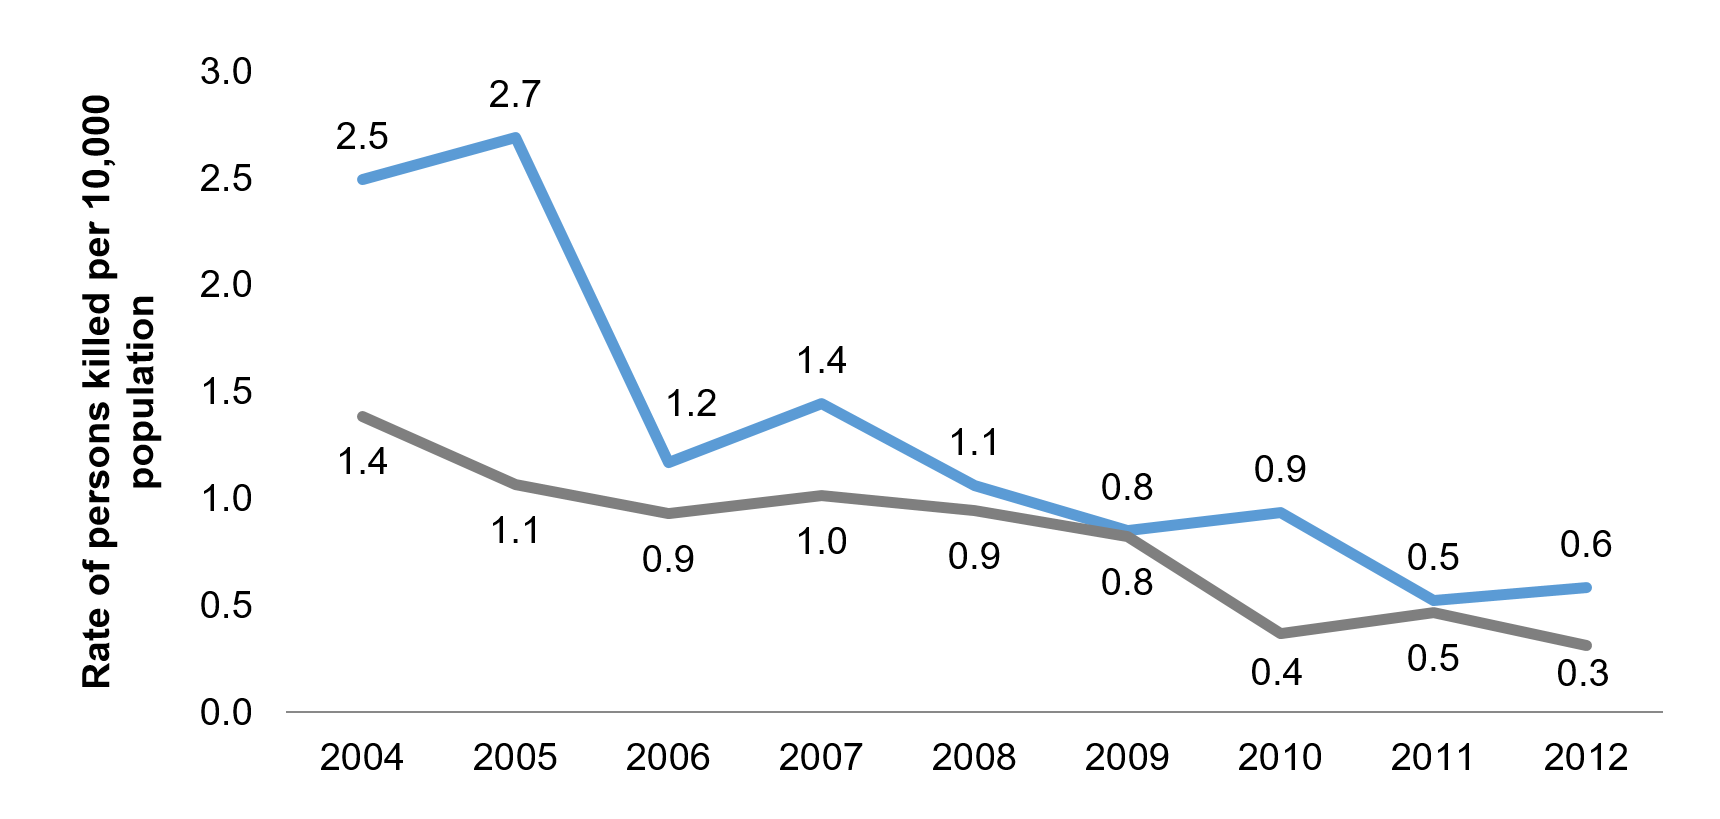
Figure 3
September 19, 2017
Dan Hull
Reading Time:
< 1
minute