To mark World GIS day, this article will look at how the Northern Ireland Assembly uses GIS to communicate data in effective and engaging ways.
What is Geographic Information (GI) and why use it?
Over 80% of data used by the public sector can be described as GI because it has a geographic element i.e. an address, a location, a Constituency area – and because of this, it can be mapped.
GIS refers to a range of software packages that helps organisations harness the geographic element of data, not only to map the data, but to analyse it in new and more powerful ways.
GIS can help to identify poorly serviced areas in relation to need; they can be used to analyse the impact of the reduction of services in a particular area; or they can be used to identify geographical areas that may require particular attention from a policy making perspective.
GIS in the Northern Ireland Assembly
The Research and Information Service (RaISe) uses the latest Ordnance Survey Northern Ireland (OSNI) data, along with an OSNI GIS Consultant to provide mapping and geographic information for a full range of research products.
Some recent work created by RaISe provides good examples of how GI guides decision making and also demonstrates the versatility of the technology.
Cancer services
In a recent paper on Cancer in Northern Ireland mapping was provided to show the service provision of various cancer facilities across Northern Ireland. The mapping was used to highlight the inequalities of service provision in urban and rural areas. Hospital based cancer services can be divided into two service groups; cancer units and regional cancer centres. A cancer unit provides more common care, such as surgery and chemotherapy, while the cancer centres provide more specialist treatments, such as radiotherapy. Prior to the opening on the North West Cancer Centre in Altnagelvin Hospital, the one regional service was based in the Belfast City Hospital.
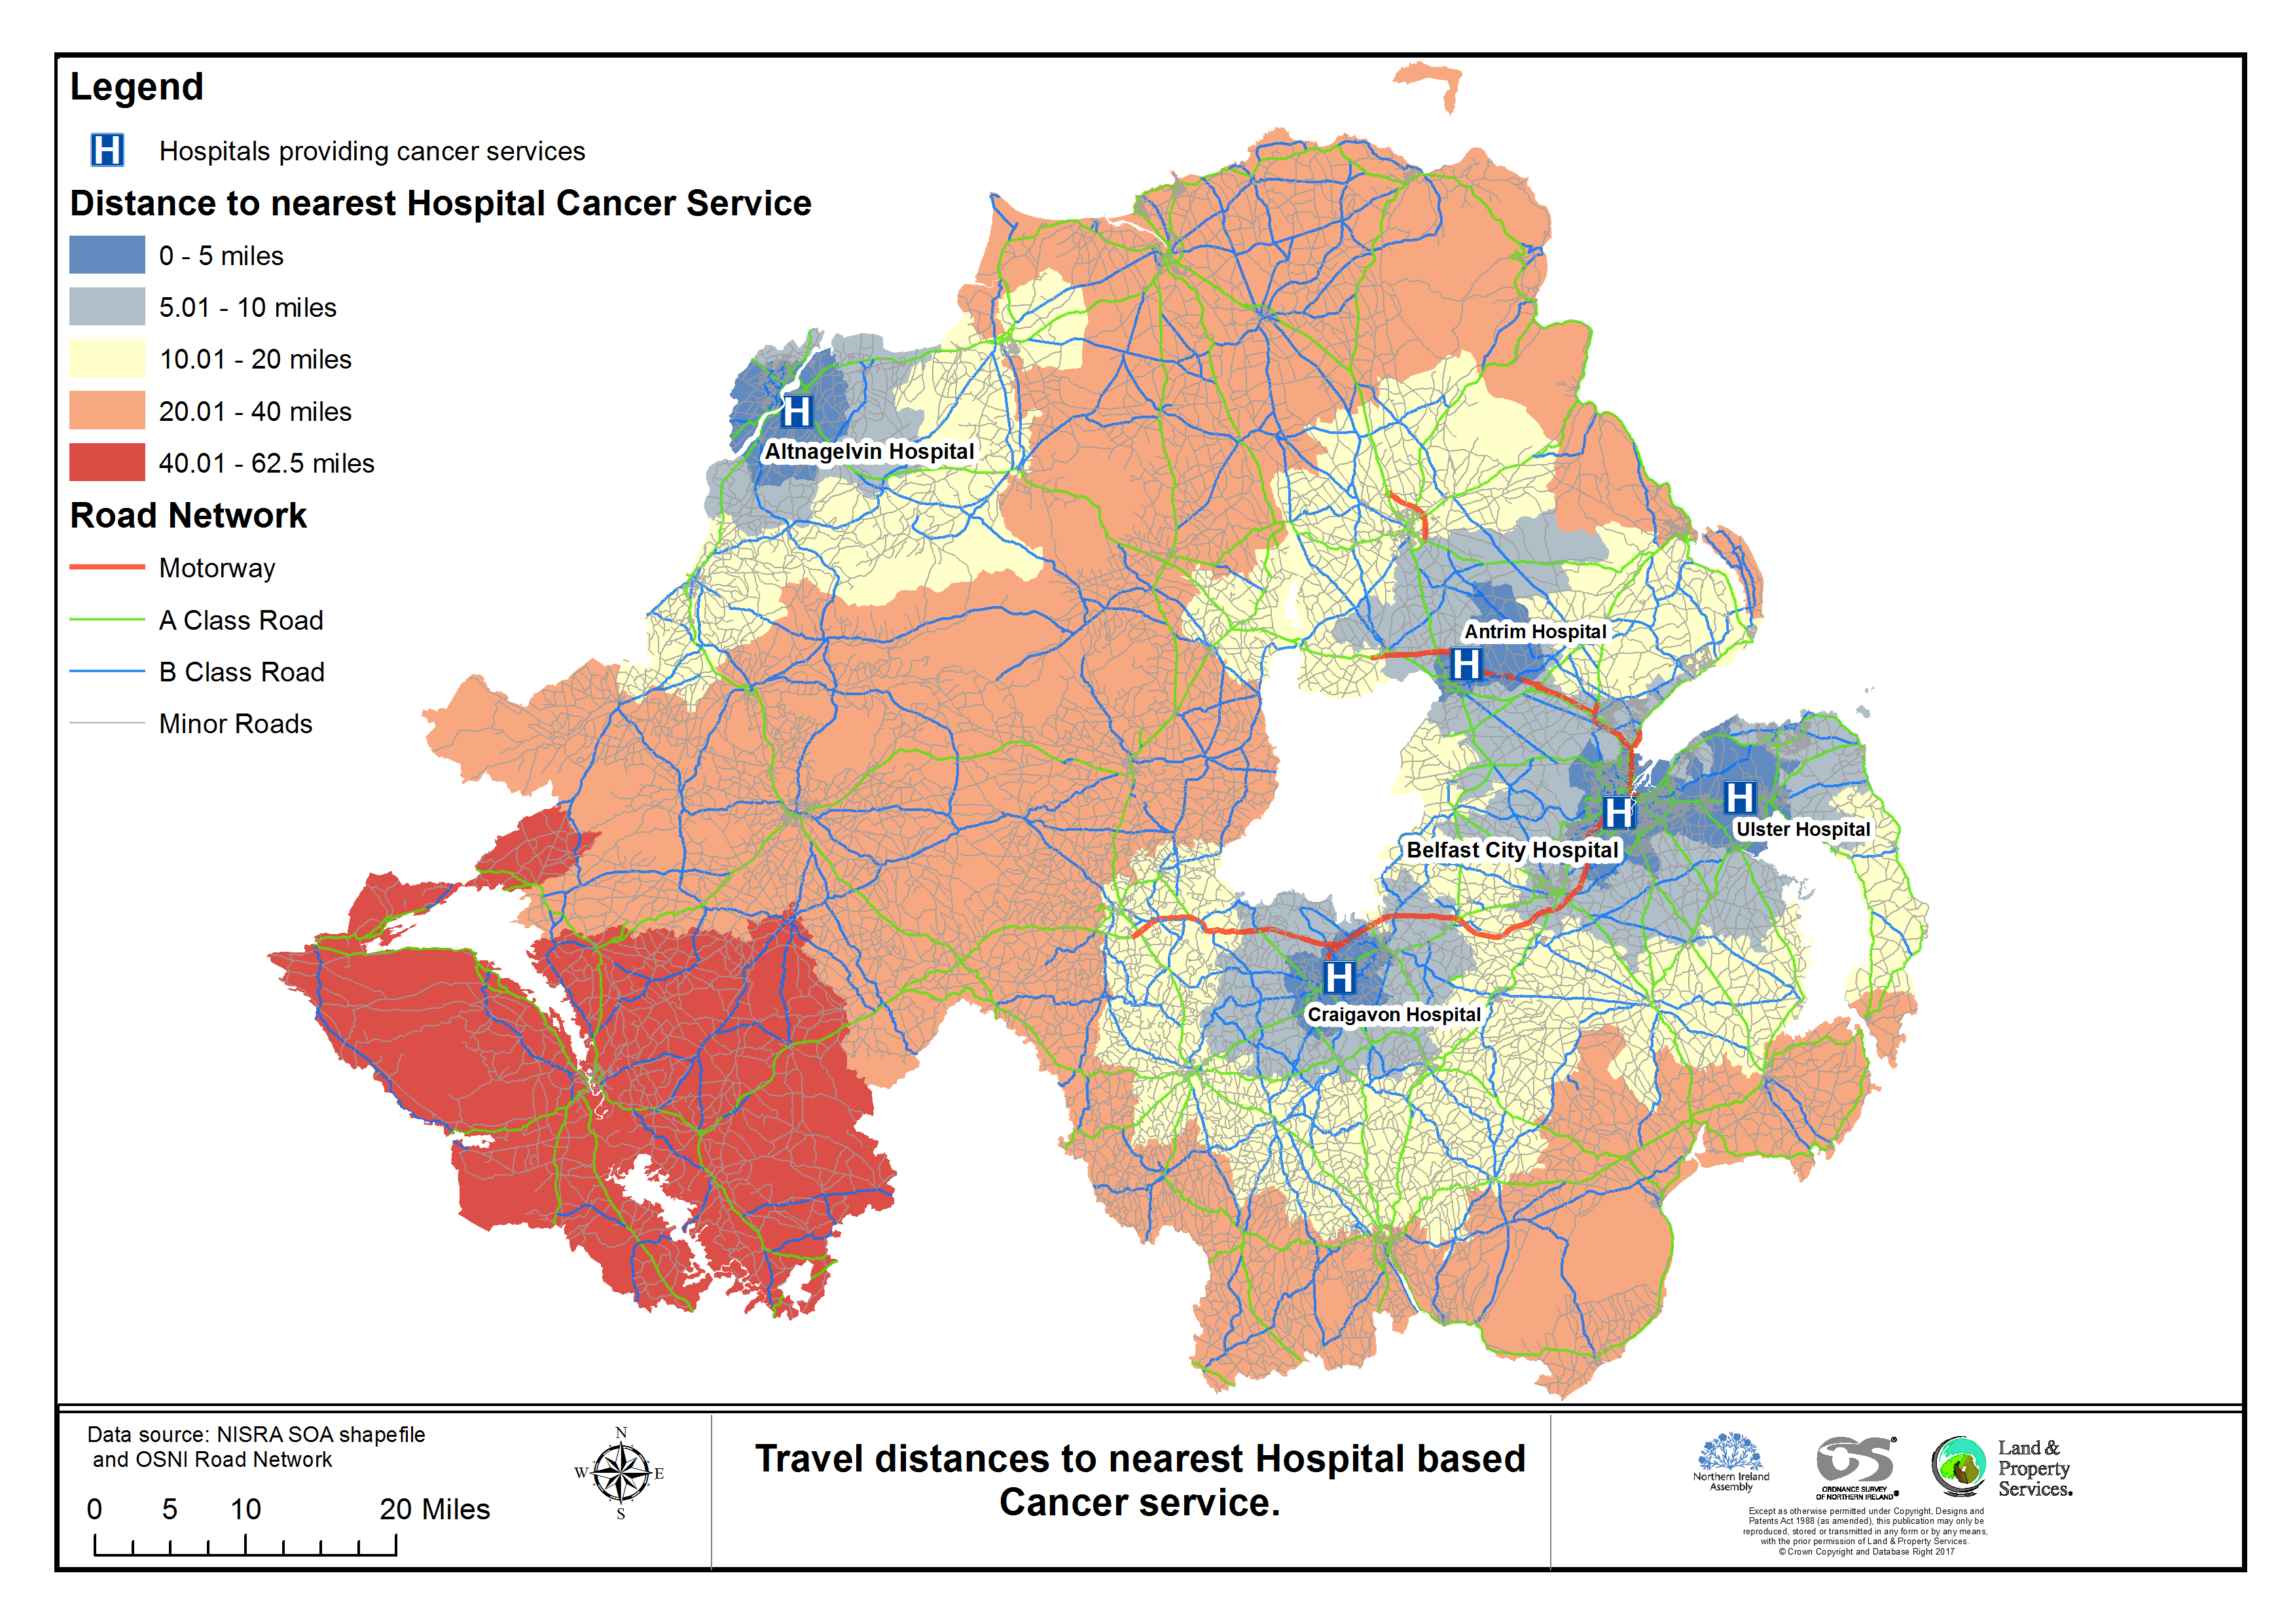
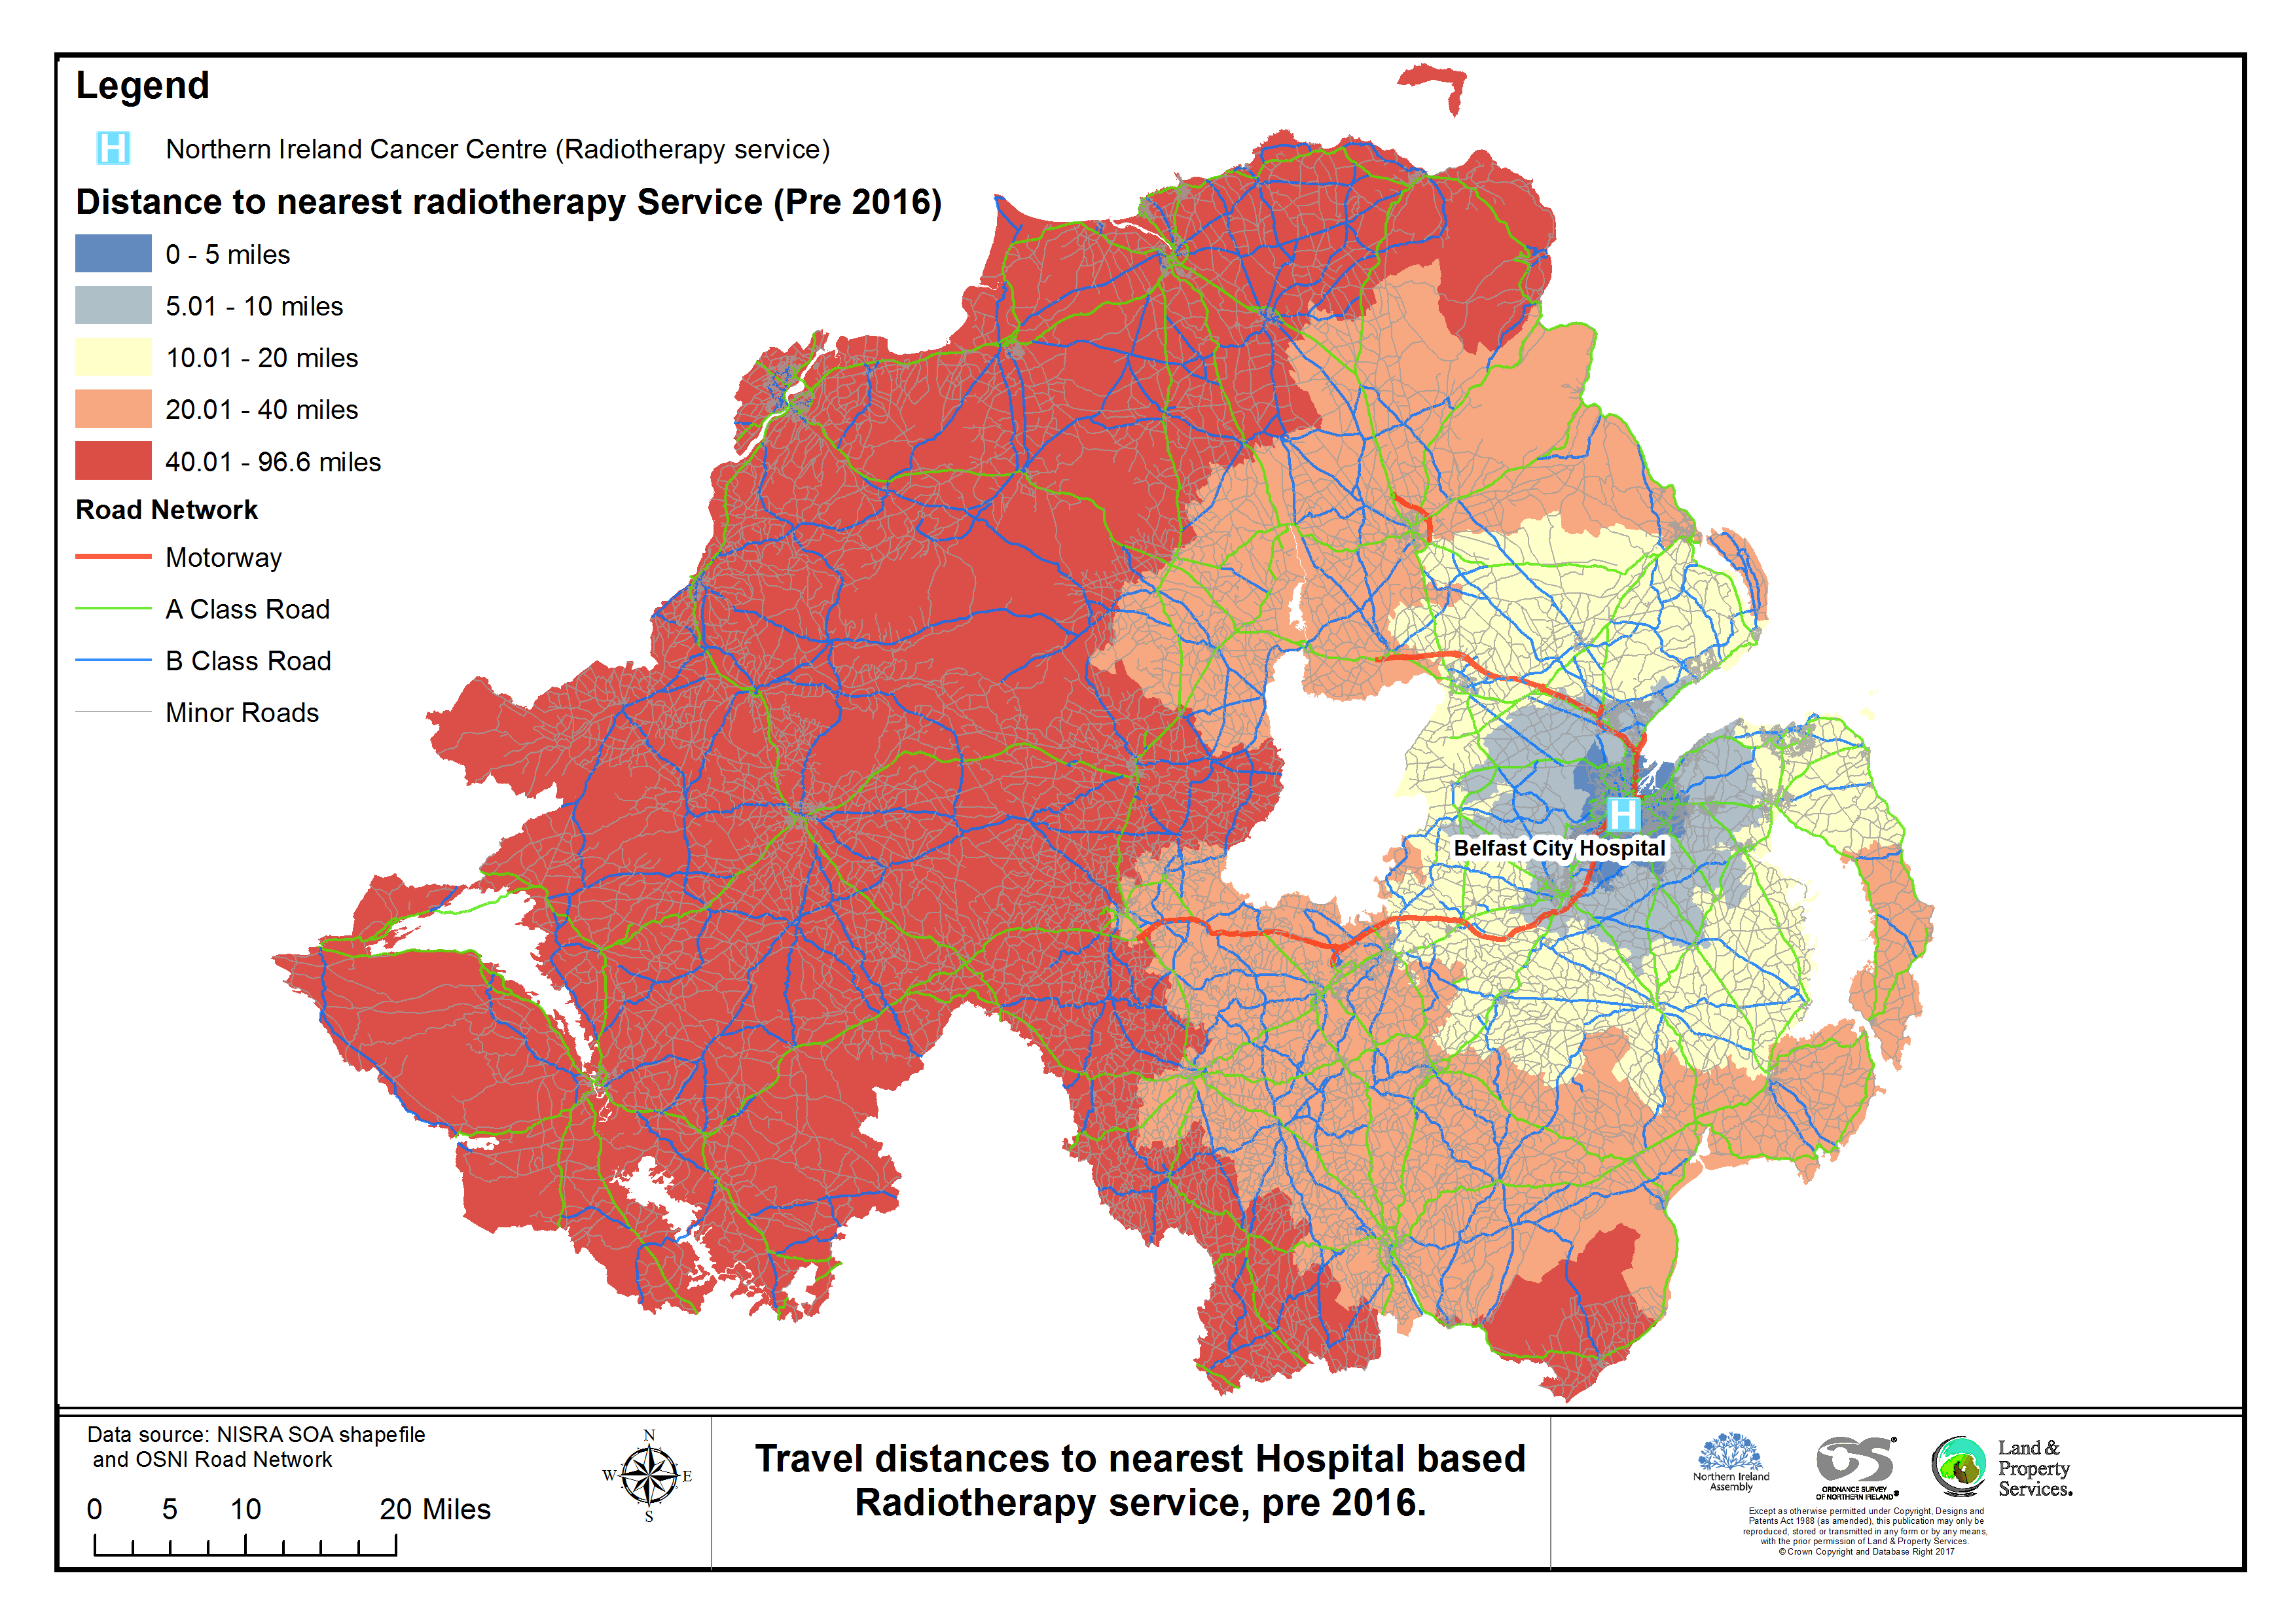
Clearly there was a need for the centre in terms of accessibility.
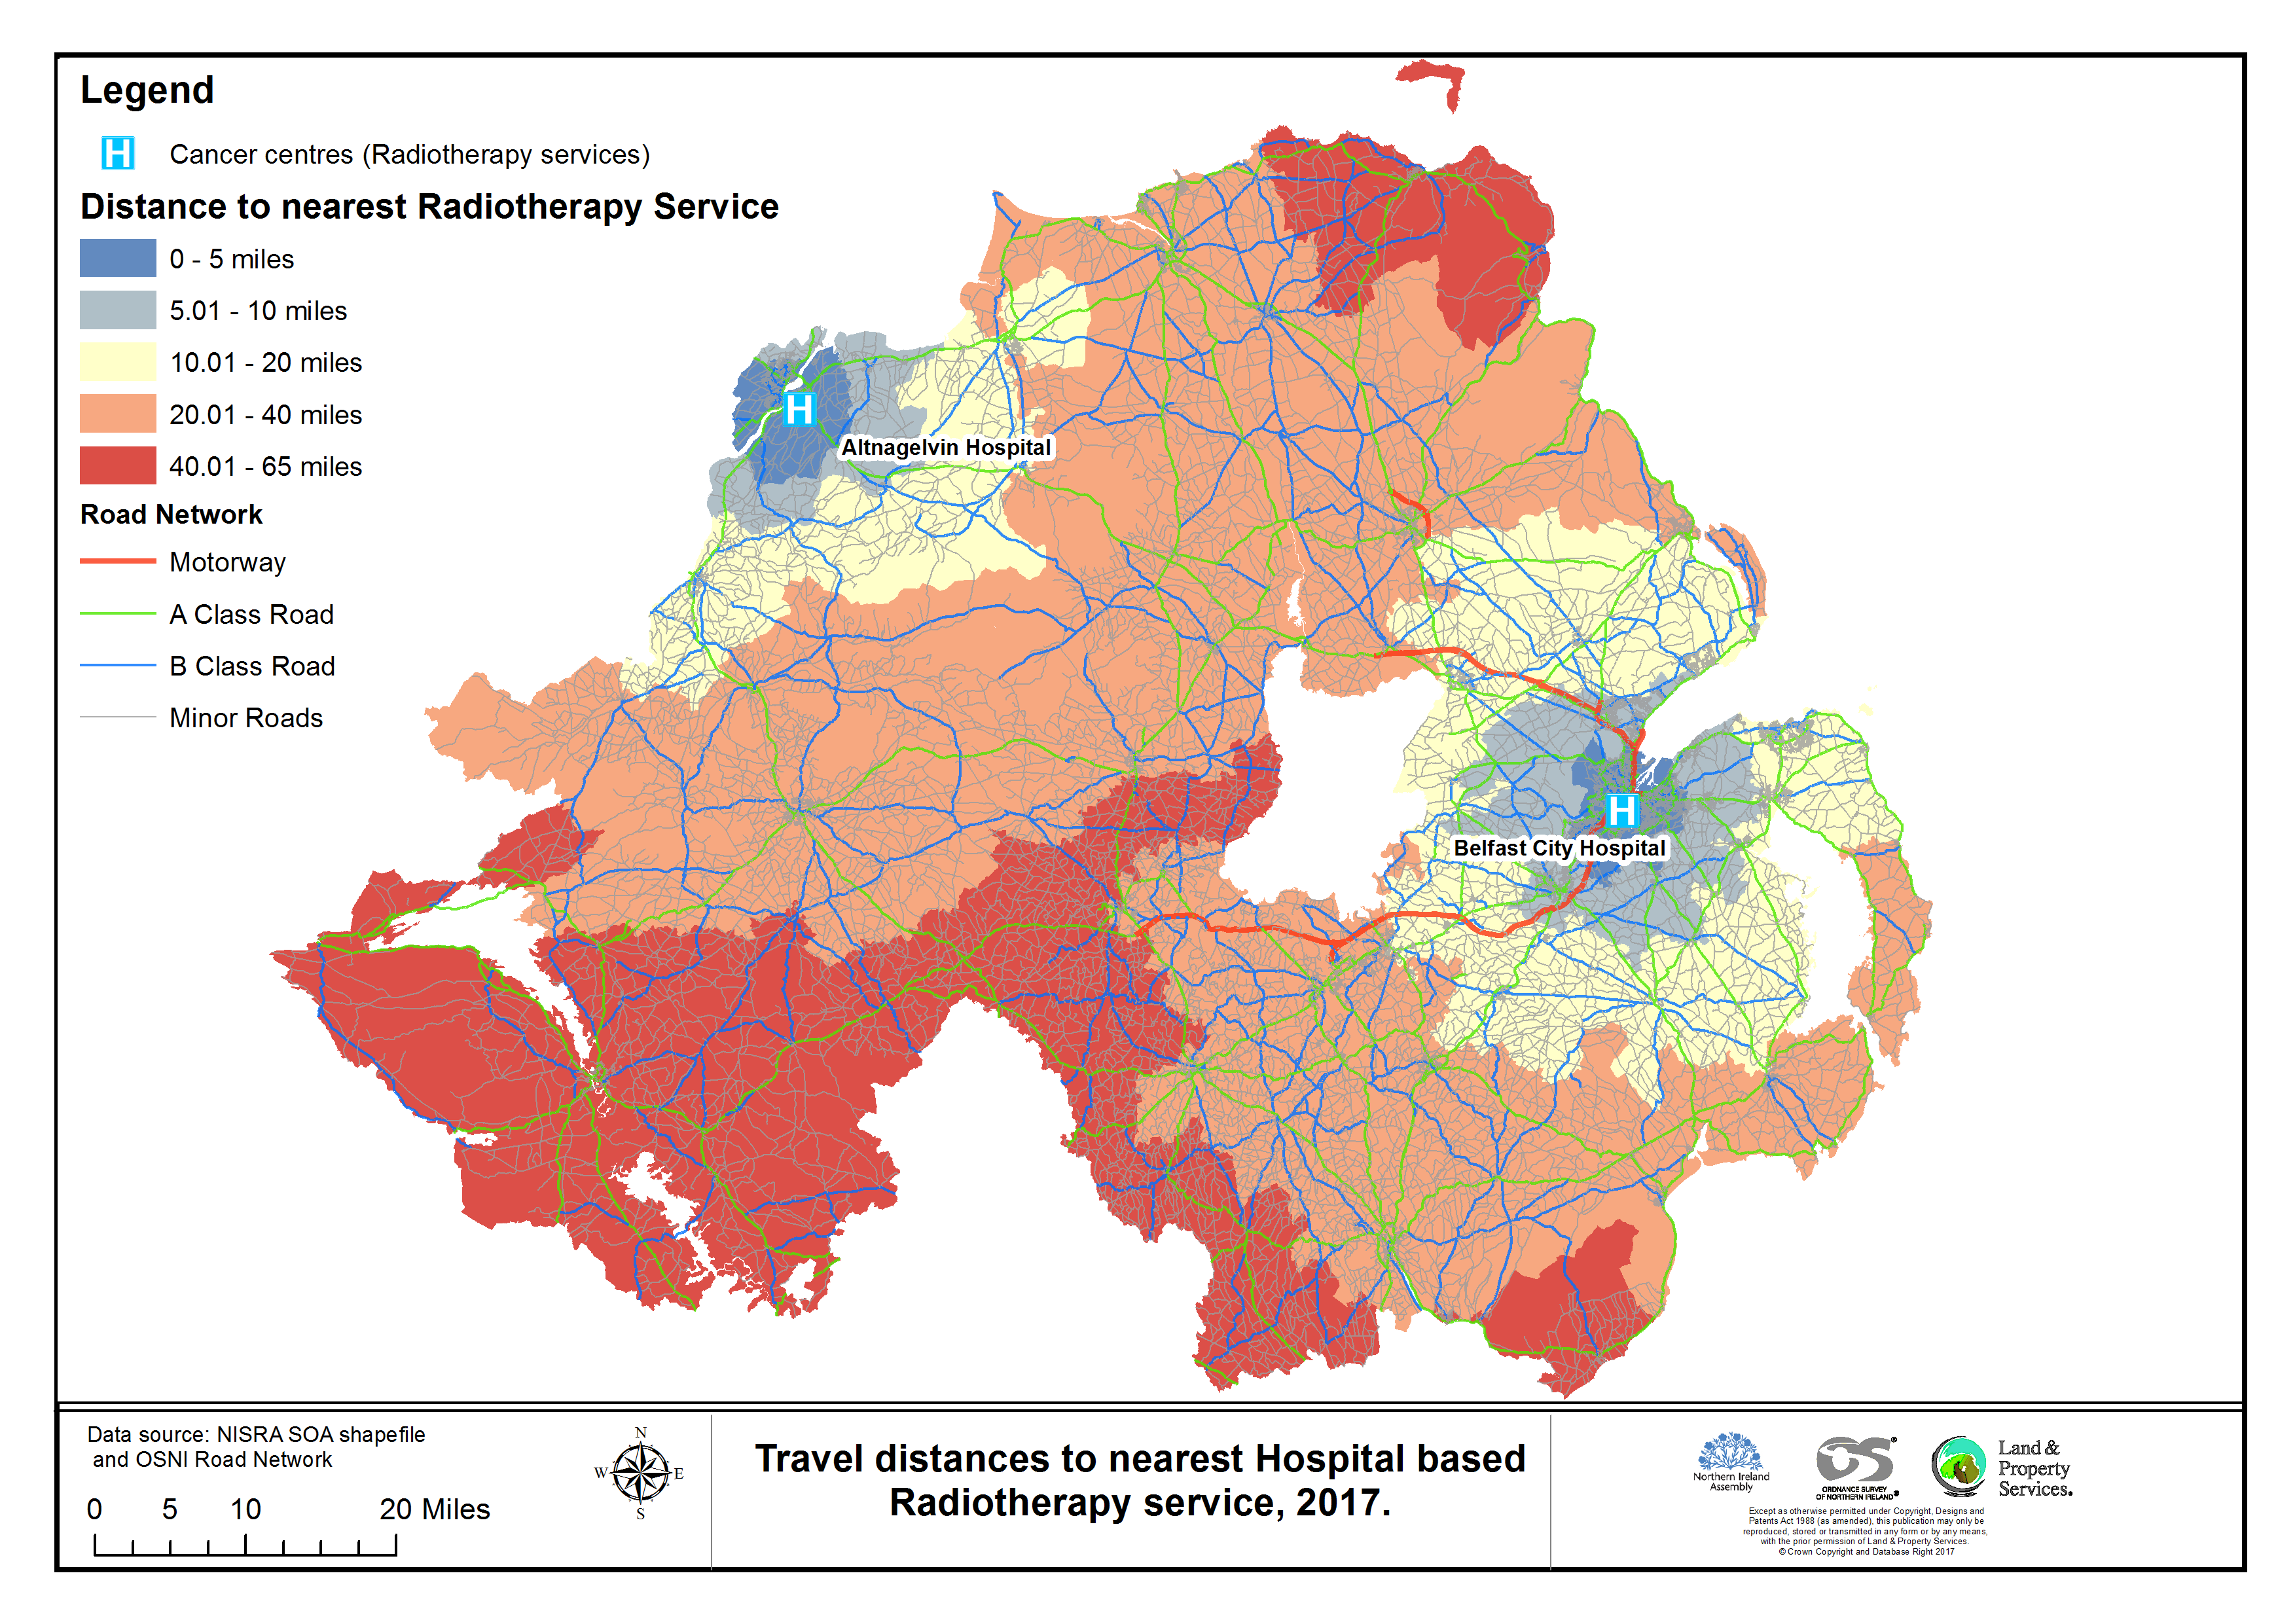
The mapping depicts an improvement in service provision, although it shows no improvement for the South West.
Using OSNI data, including a digital model of the Northern Ireland road network, travel distances could be mapped out from locations of the services. In terms of using this approach for other projects, the services don’t have to be hospitals; more localised services can also be analysed, where it could be the distance to a local school or GP practice. There is a vast amount of data available on open data sites, which include service locations, meaning it is becoming easier to measure accessibility for a range of public services.
Helping to answer the big questions: Where do road traffic accidents occur?
A recent blog article looked at the border region and road safety. Using GIS, all the border roads and crossing points were mapped allowing a statistical breakdown of the border roads by road classification. This mapping provides essential background information to make informed decisions regarding road safety along the border area. This mapping is also relevant to show the infrastructure in the border region.
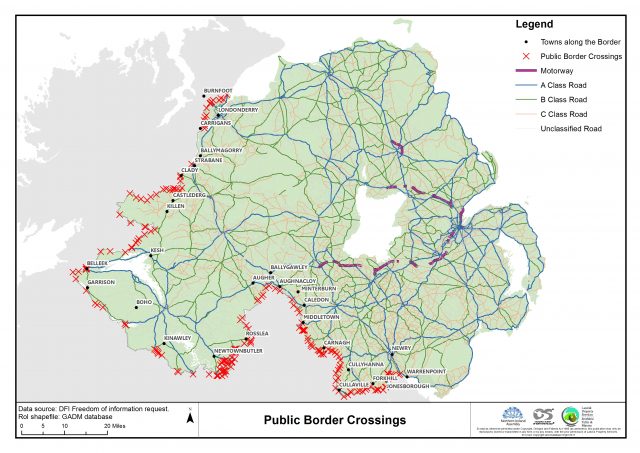
Table 1: Classifications of the Border Roads.
| Road Class | Number of Crossings by Road Class | % of Crossings in each Road Class |
| A | 23 | 12% |
| B | 16 | 8% |
| C | 14 | 7% |
| U | 142 | 73% |
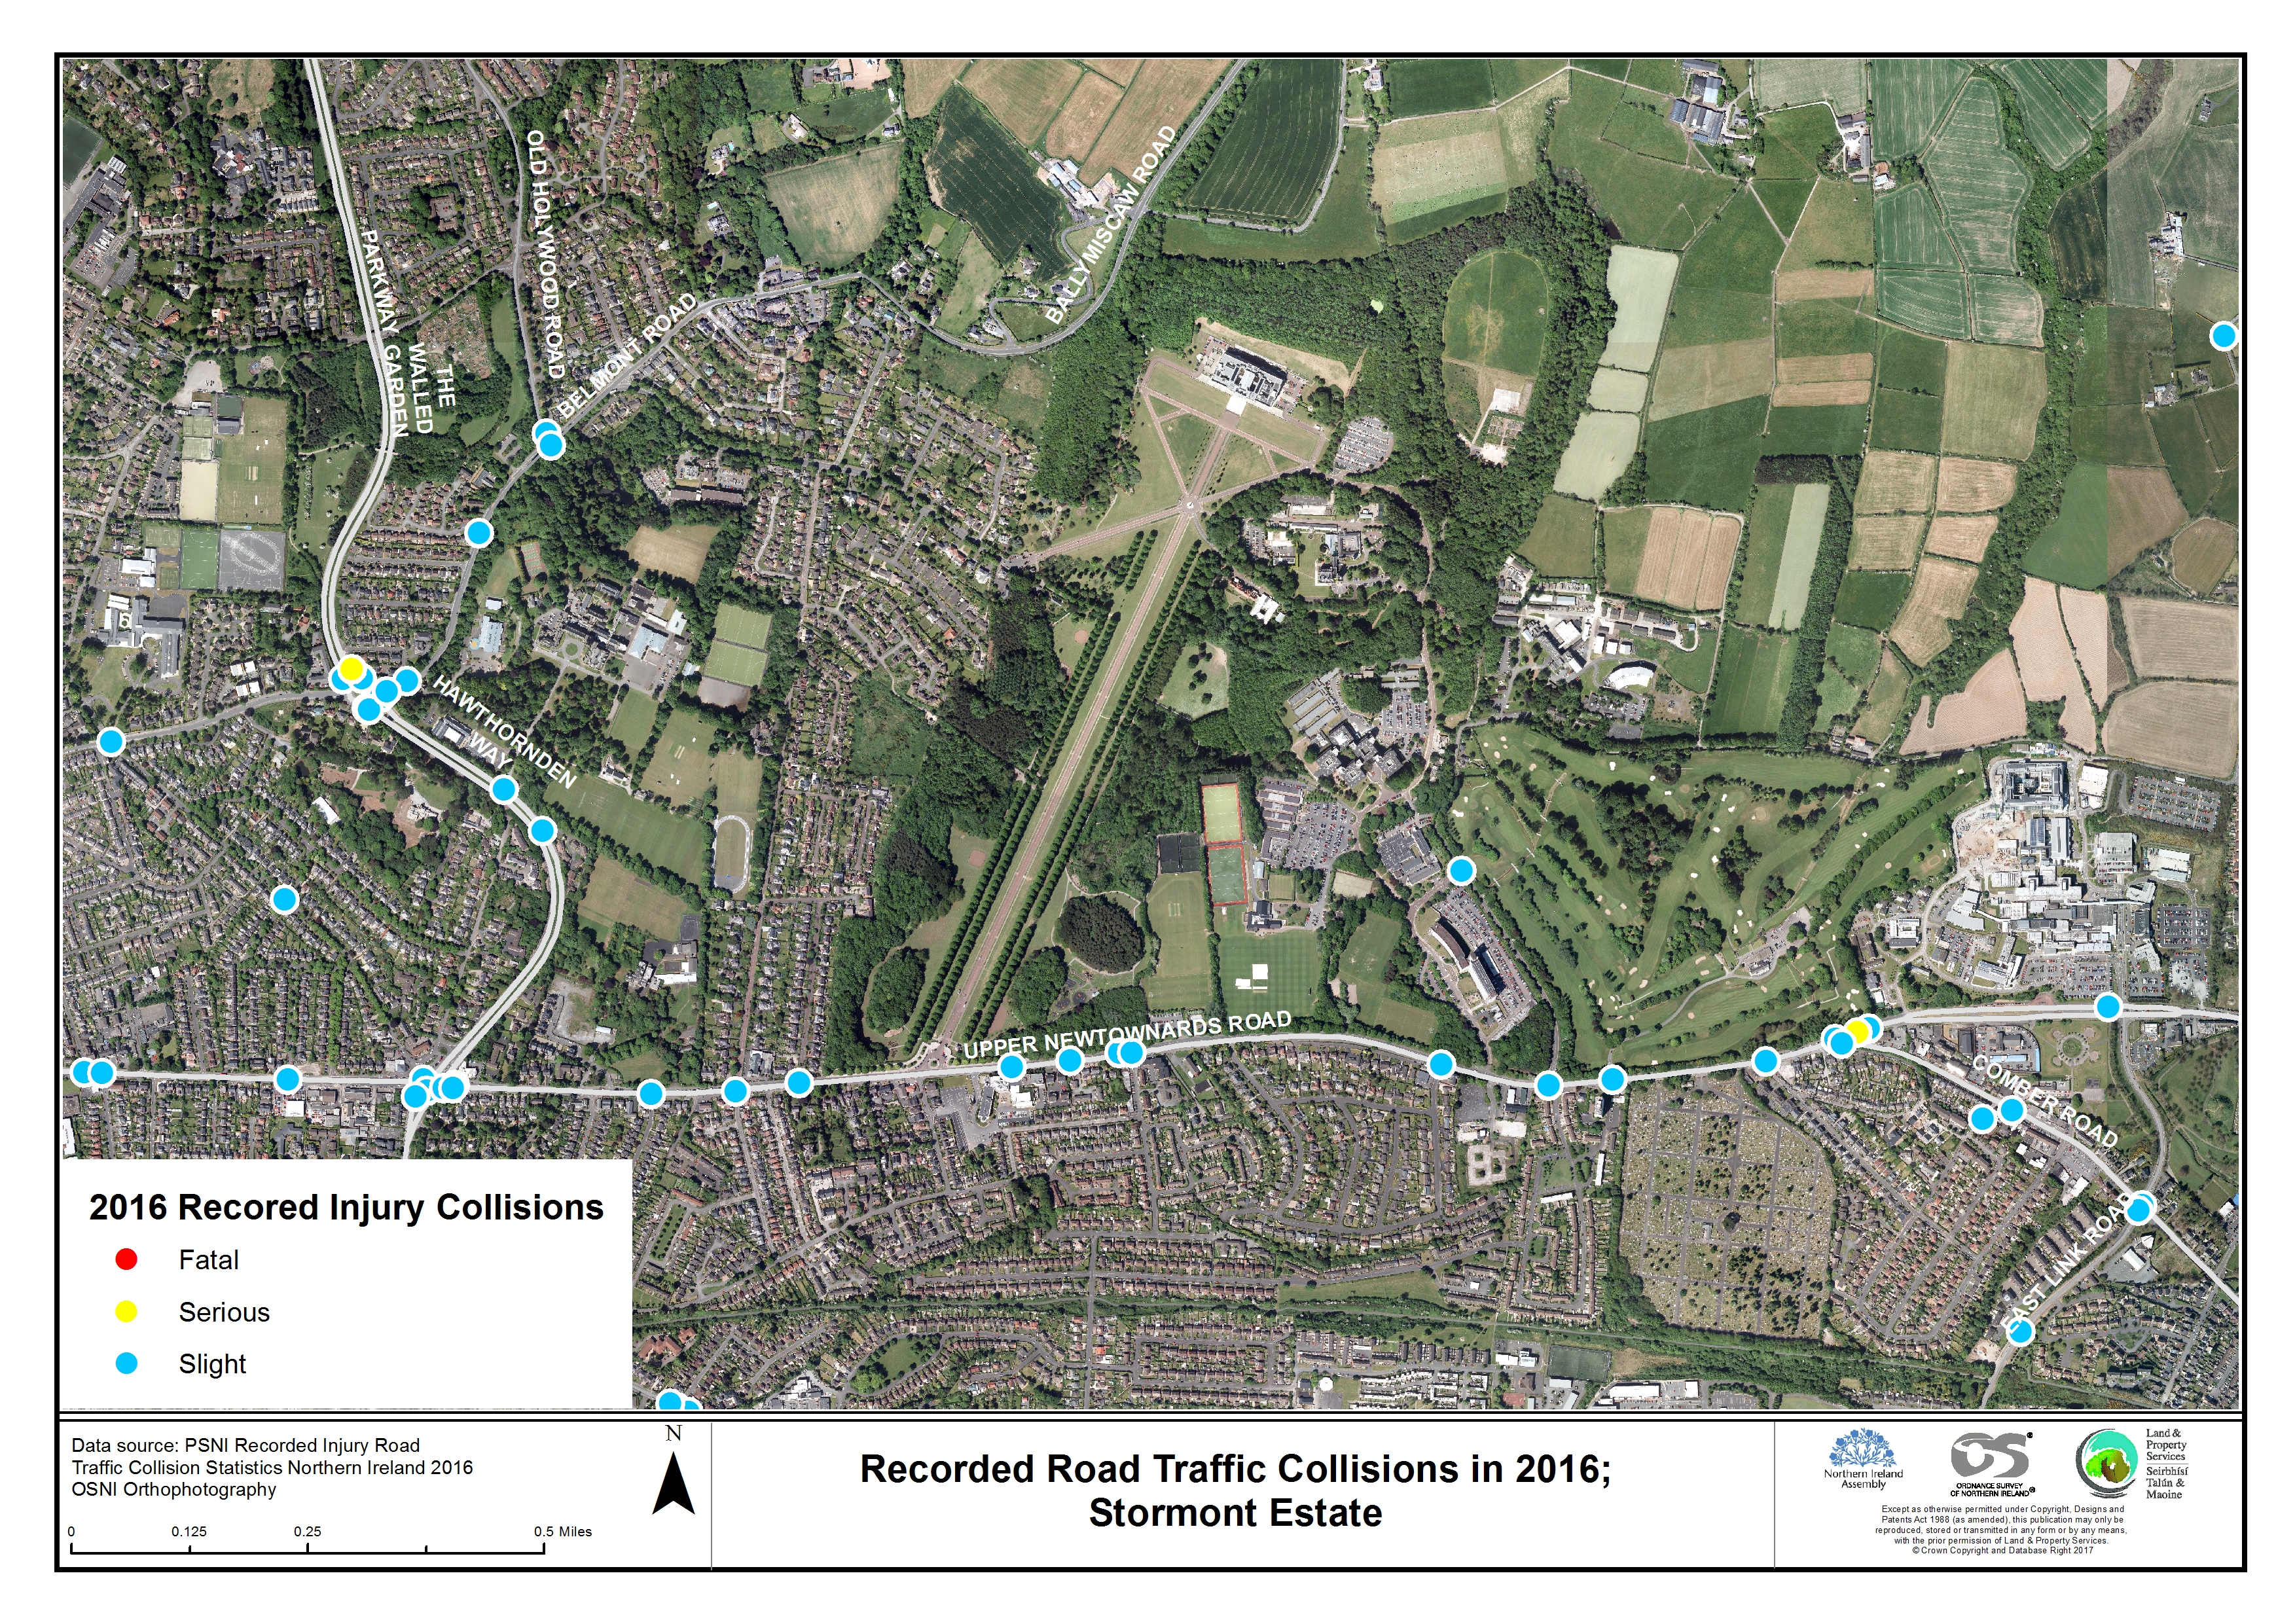
A common research topic posed to RaISe concerns road traffic collisions and where they occur. The Police Service of Northern Ireland (PSNI) keep a record of all recorded injury road traffic collisions across Northern Ireland, including their coordinates. The coordinates or addresses are the details necessary to convert numbers on an excel sheet to a point on a map. This data is available on the Open Data portal NI, meaning that anyone can get access to this information. However, GIS is required to display the locations of the incidents.
Mapping the political landscape
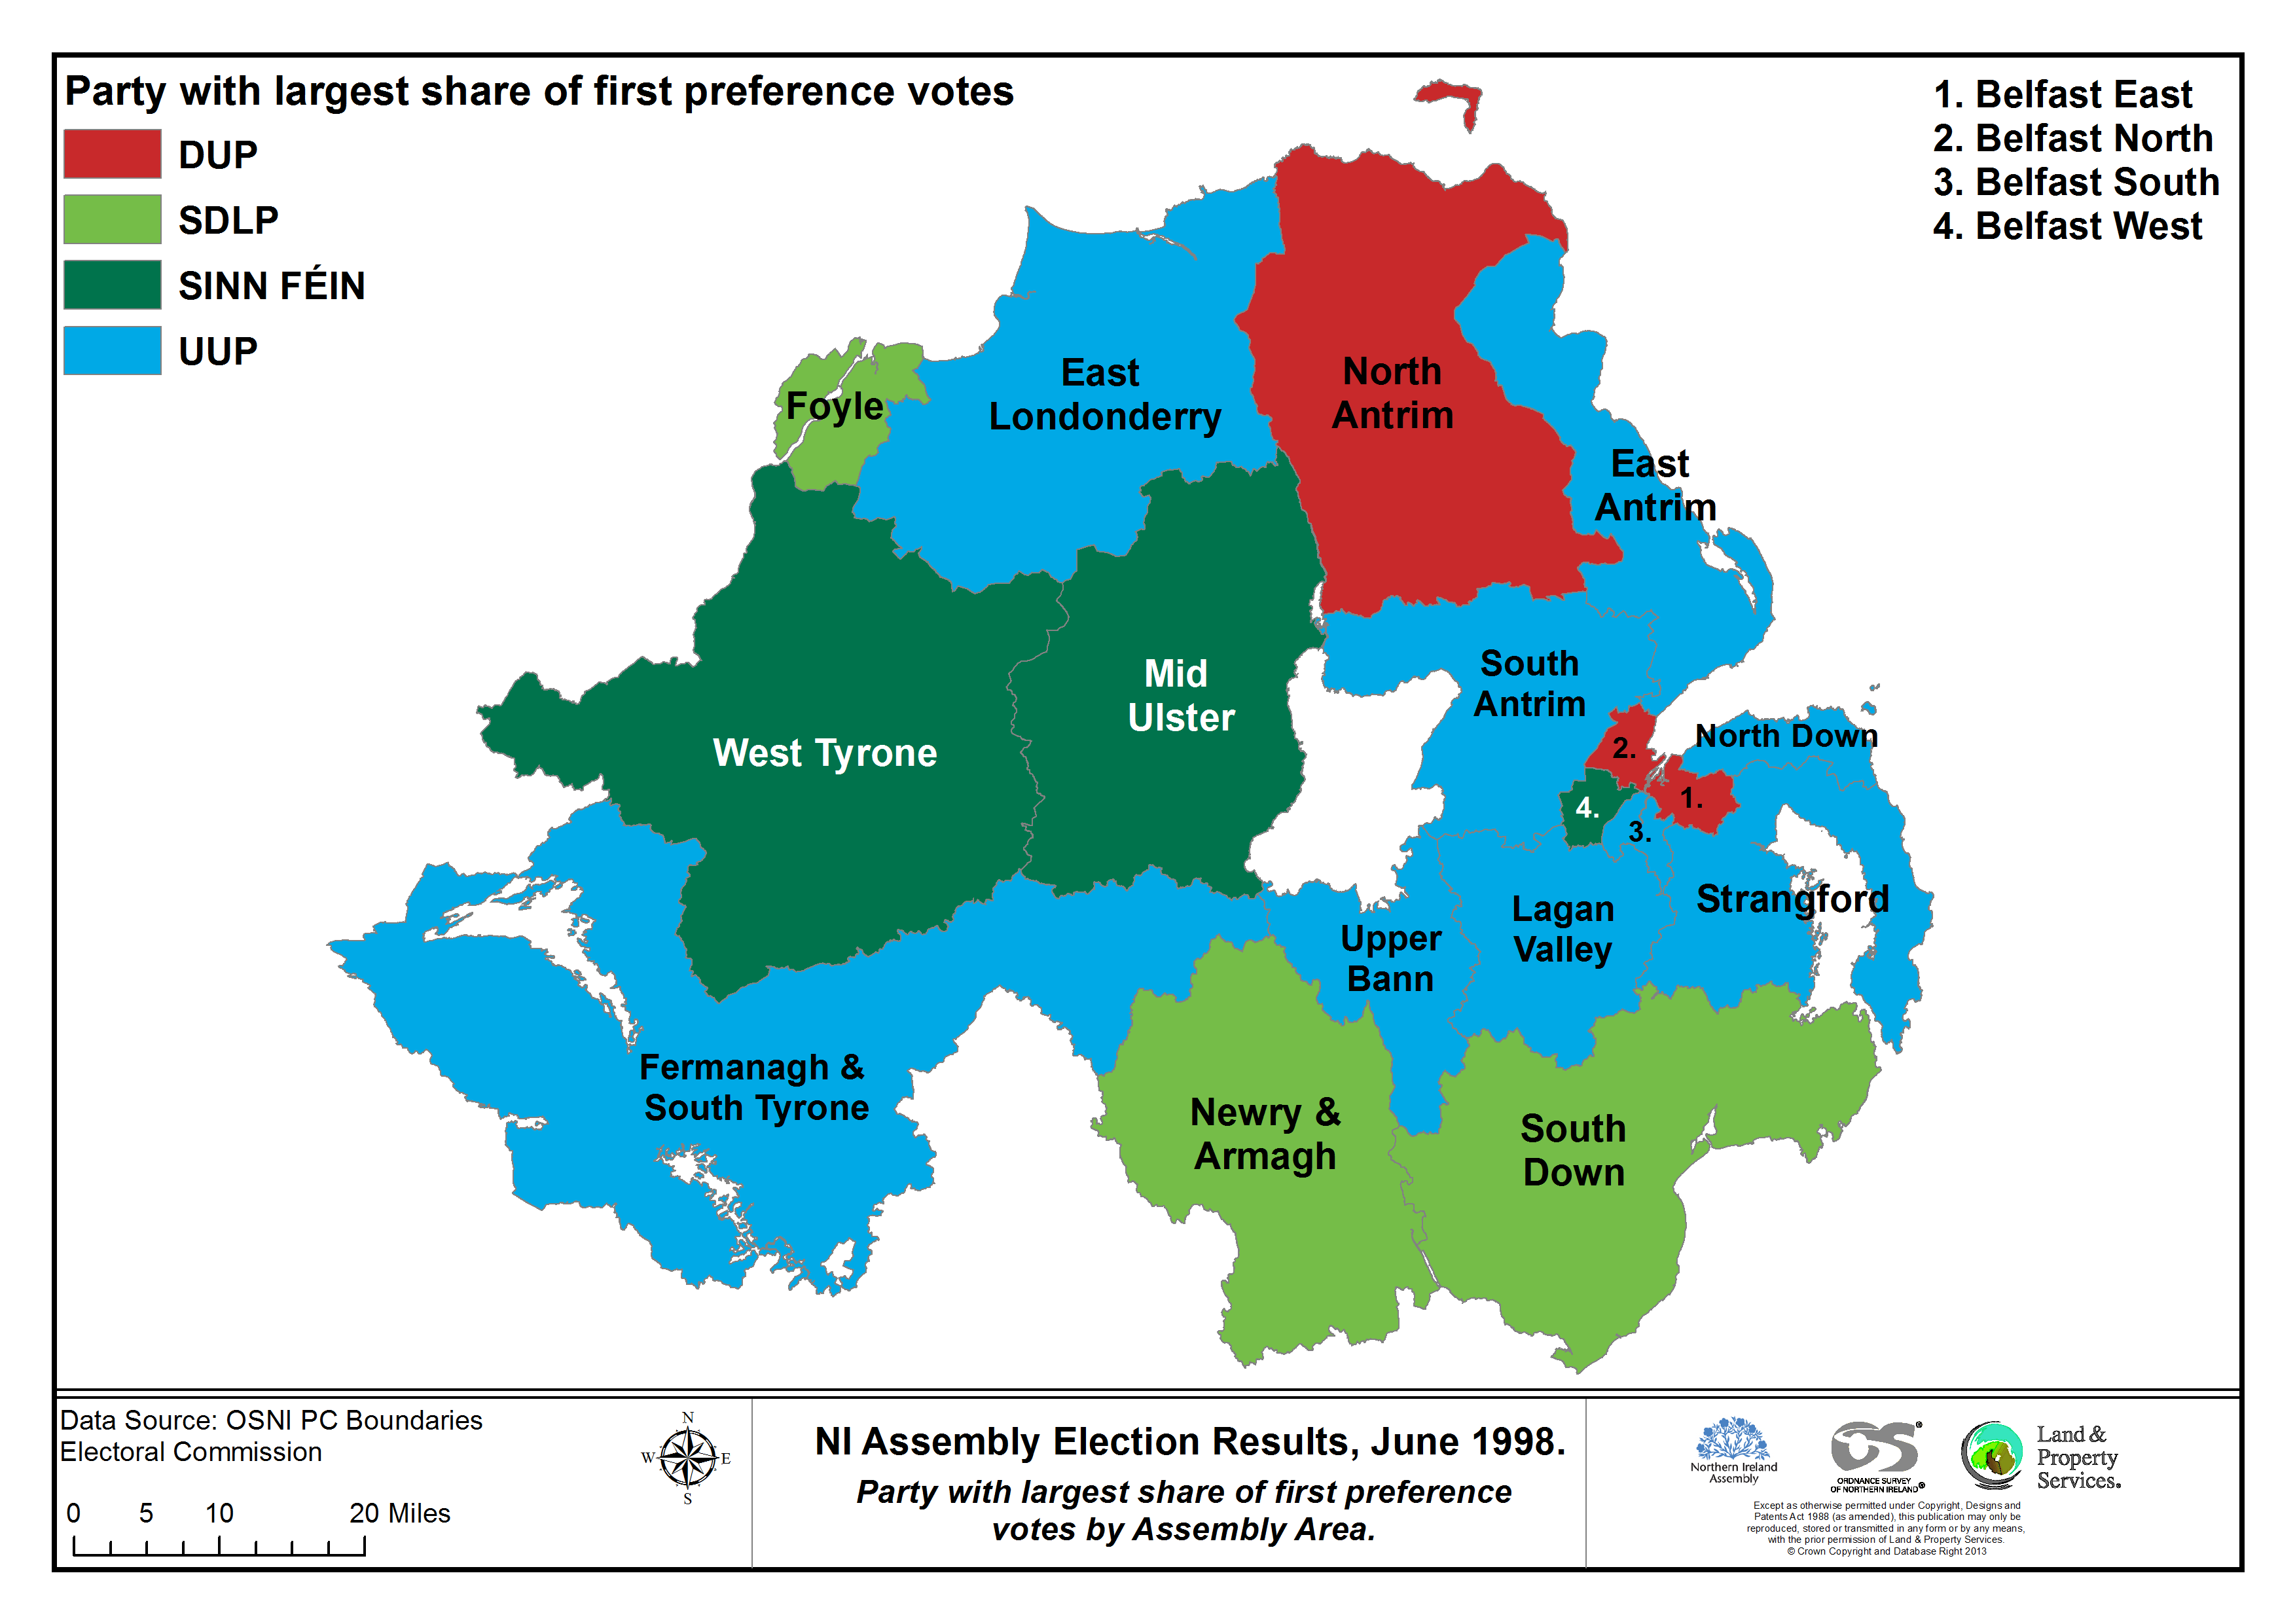
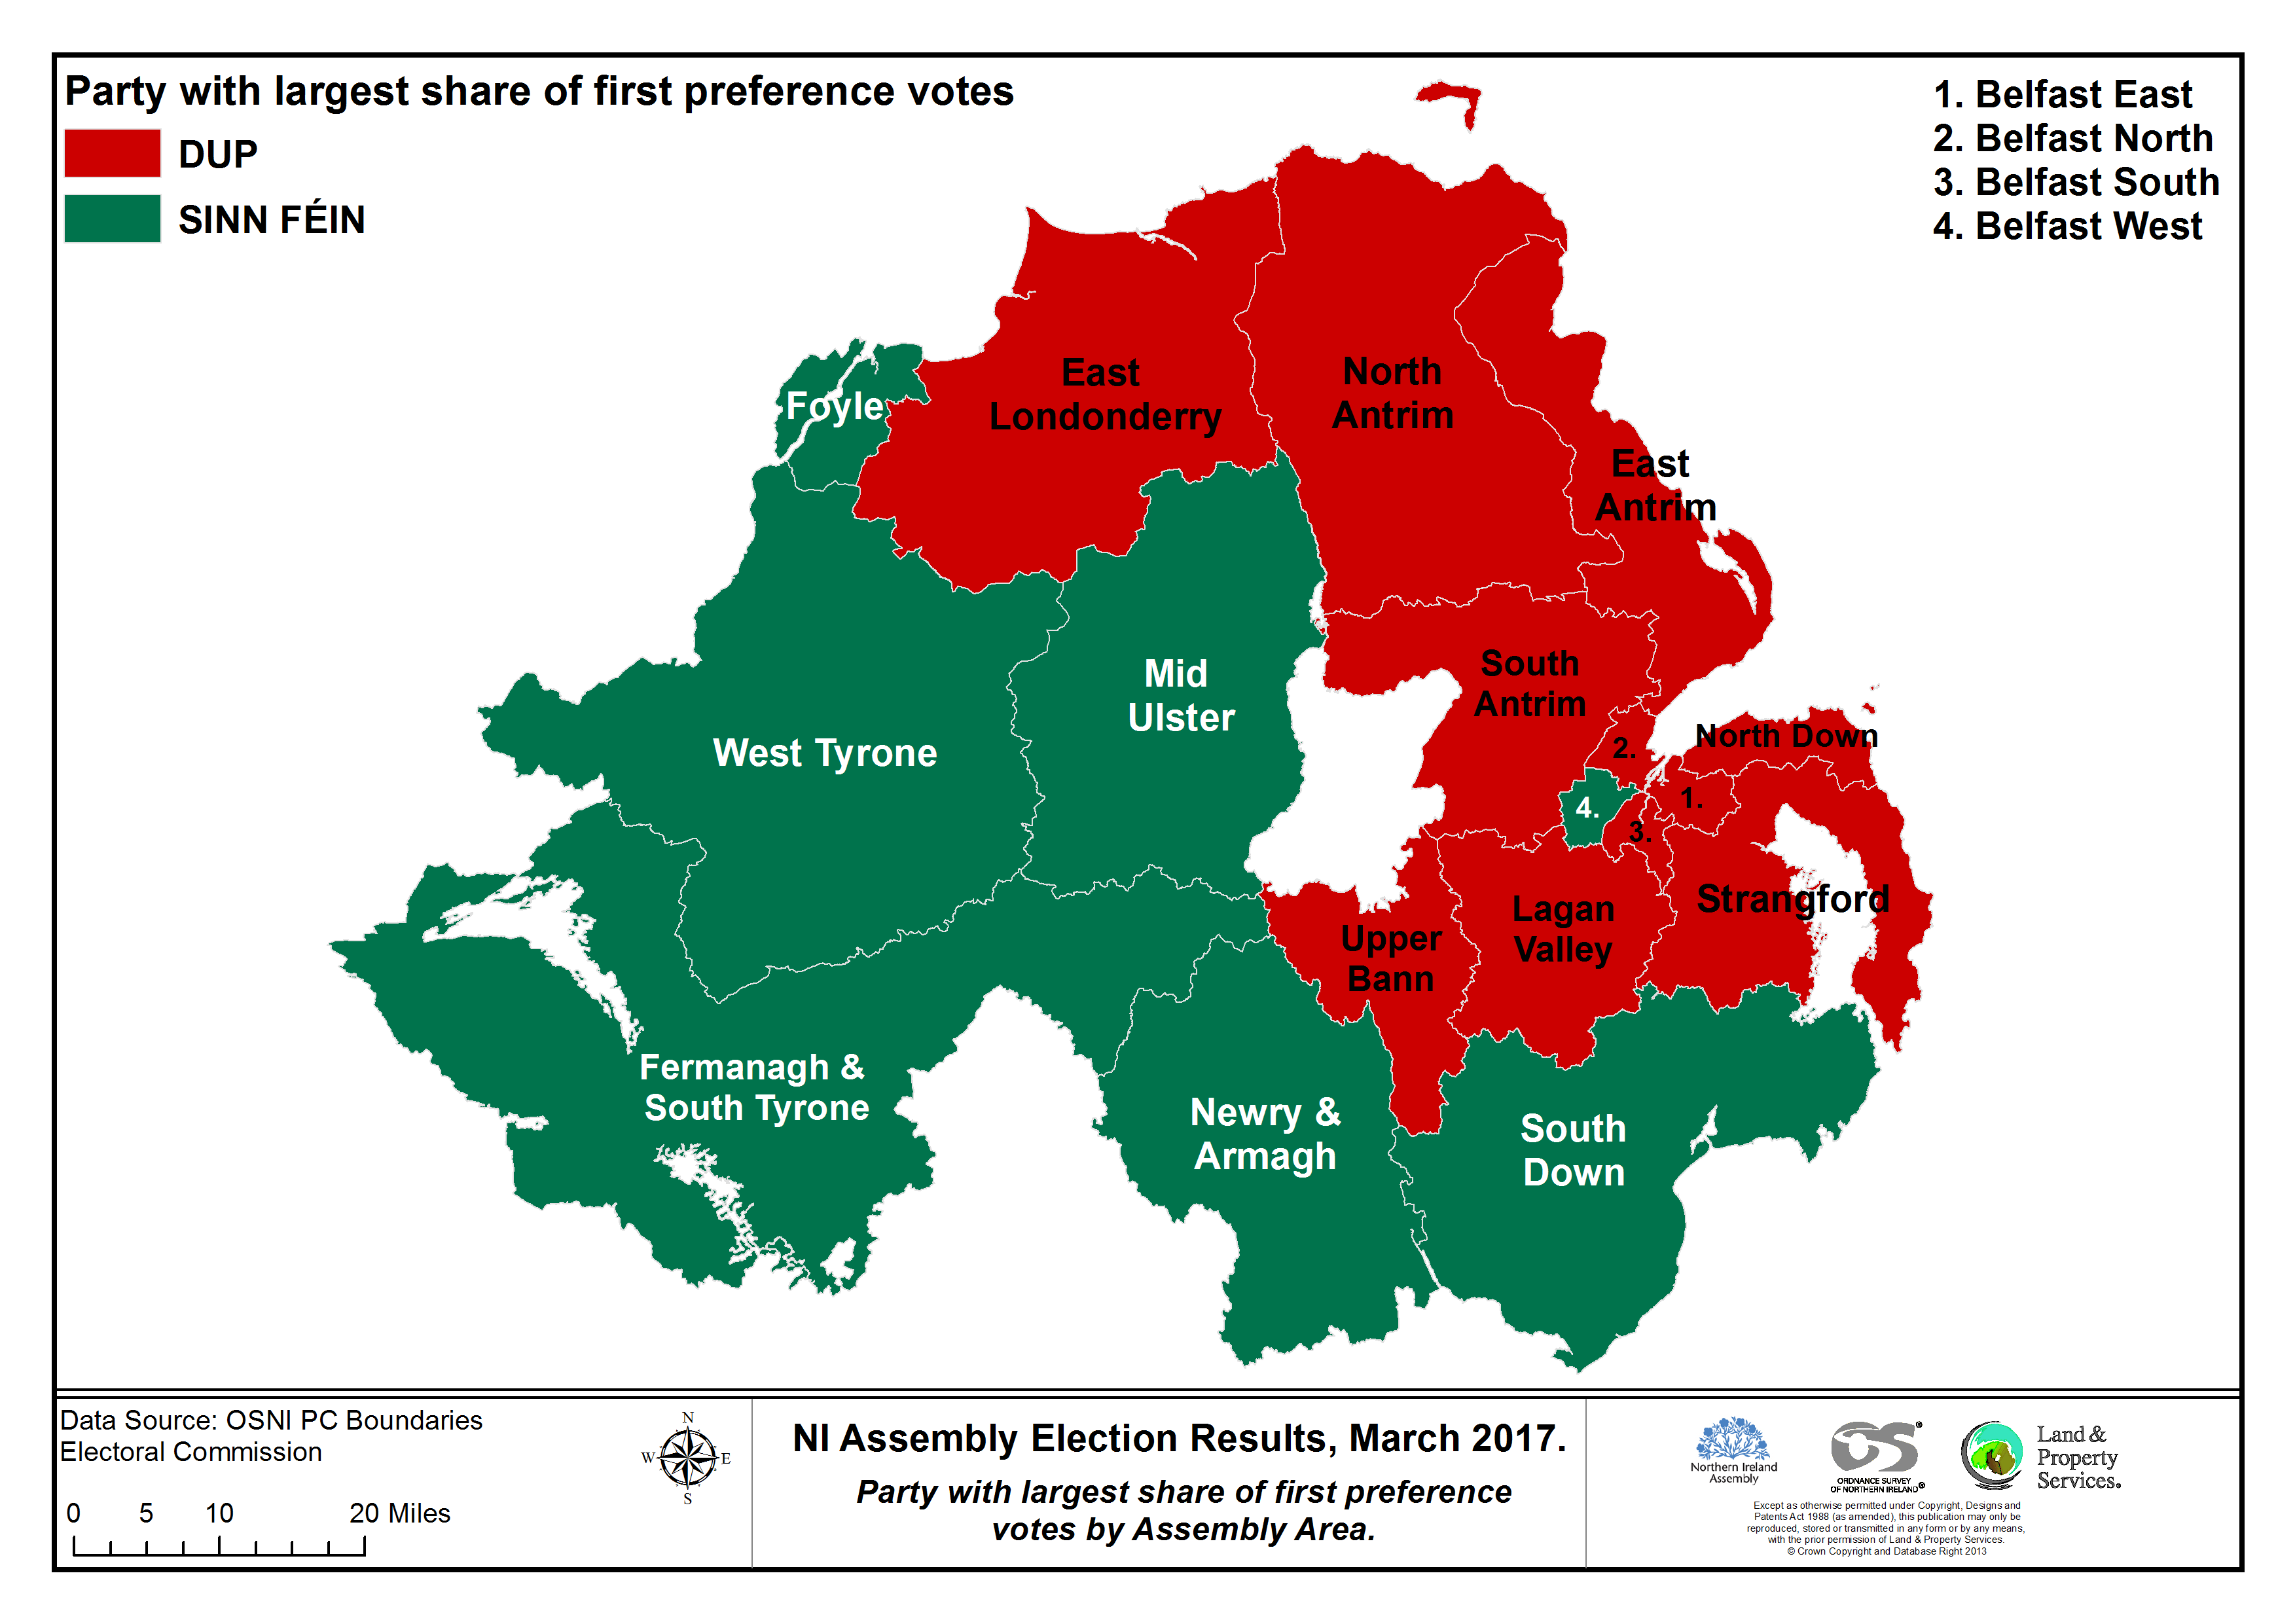
GIS can also be used to display election results across all the Constituency areas, as seen from the mapping in the recent Assembly and Westminster election papers. However, an interesting analysis is comparing the change over time between the Assembly Election results of 1998, to the most recent in March 2017. All that is required to create these maps is the name of the Party with the largest share of first preference votes in each Constituency area.
It seems clear that GIS has a wide range of uses when presenting data; it enables various disciplines such as geography, statistics and politics to be combined and analysed, and this is why it is worth marking. Everything happens somewhere and GIS has the means to display it.