Measures which show the spatial distribution of deprivation have been used in Northern Ireland since the 1990s, and play a prominent role in terms of informing the targeting of resources to the most deprived areas in Northern Ireland.
The latest iteration in the series, namely the Northern Ireland Multiple Deprivation Measure 2017 (NIMDM 2017) was released by the Northern Ireland Statistics and Research Agency (NISRA) in November 2017. This post provides an overview of key findings from the NIMDM 2017 at the Northern Ireland geographical level.
Background
The current measure updates and replaces the previous deprivation measure, known as the NIMDM 2010. The results are presented at the Super Output Area (SOA) level, the key geography for the NIMDM. Northern Ireland is divided into 890 SOAs. In terms of population, they range in size from 381 to 5,832 people with an average size of around 2,100 people. The number of SOAs in each of the 18 parliamentary constituencies varies, ranging from 41 in Fermanagh and South Tyrone to 58 in Belfast South.
The NIMDM 2017 provides a mechanism for ranking small areas within Northern Ireland in the order of the most deprived to the least deprived. However, the measure is relative, rather than absolute, and does not quantify the extent to which one area is more or less deprived than another. In other words, the NIMDM allows one to say that “area A is more deprived than area B”, but not by how much. Further, while the NIMDM 2017 updates the 2010 measure, it is not possible to directly compare across the two time periods to make a judgement on whether an area has become more or less deprived over time. This is because the measure provides a spatial ranking at a single point in time.
As the NIMDM 2017 is an area-based measure, it does not identify individuals who are deprived. Instead, it identifies local areas where there are concentrations or spatial clusters of several different types of deprivation.
The NIMDM 2017 consists of 38 indicators, compared with 30 in the older 2010 measure. These relate to seven different types or ‘domains’ of deprivation, namely: Income Deprivation, Employment Deprivation, Health Deprivation and Disability, Education, Skills and Training Deprivation, Access to Services, Living Environment and Crime and Disorder. The seven domains contribute to the overall measure by a weighting system.
Results
Map 1 shows the spatial distribution of multiple deprivation across Northern Ireland, and also locates the ten most deprived SOAs in Northern Ireland, based upon their overall ranking in the NIMDM 2017. In the map, the colour dark red denotes the ten per cent most deprived SOAs, while dark blue illustrates the ten per cent least deprived SOAs.
![Map 1, showing a spatial distribution of Multiple Deprivation across Northern Ireland (SOA level; Source: NISRA [2017] MDM results at SOA Level)](https://www.assemblyresearchmatters.org/wp-content/uploads/2018/06/MDM-2017-SOA-level.png)
Table 1 lists the top 20 most deprived SOAs in Northern Ireland in 2017. East (Strabane), in the constituency of West Tyrone, is the most deprived SOA in Northern Ireland (rank = 1), followed by Water Works 2 (Belfast North) and Crevagh 2 (Foyle). In total, nine of the 20 most deprived SOAs in Northern Ireland are located in Belfast North, six in Foyle, and two in Belfast West.
Table 1: Top 20 Most Deprived SOAs in Northern Ireland 2017 (source: NISRA [2017] MDM results at SOA Level)
| Rank | SOA name | Constituency |
| 1 | East | West Tyrone |
| 2 | Water Works 2 | Belfast North |
| 3 | Crevagh 2 | Foyle |
| 4 | Ardoyne 2 | Belfast North |
| 5 | Strand 1 | Foyle |
| 6 | The Diamond | Foyle |
| 7 | New Lodge 2 | Belfast North |
| 8 | Woodvale 1 | Belfast North |
| 9 | Ardoyne 3 | Belfast North |
| 10 | Creggan Central 1 | Foyle |
| 11 | Greystone | East Londonderry |
| 12 | Woodvale 2 | Belfast North |
| 13 | Brandywell | Foyle |
| 14 | Woodville 1 | Upper Bann |
| 15 | Water Works 1 | Belfast North |
| 16 | Ardoyne 1 | Belfast North |
| 17 | Woodvale 3 | Belfast North |
| 18 | Shankill 2 | Belfast West |
| 19 | Shantallow West 1 | Foyle |
| 20 | Collin Glen 2 | Belfast West |
Multiple Deprivation in Parliamentary Constituencies
Multiple deprivation can also be examined at the parliamentary constituency (PC) level, although this has limited utility, primarily because the measure is designed to highlight local concentrations or clusters of deprivation in small areas, rather than in larger geographies such as PCs. Nonetheless, one method of illustrating the degree of deprivation in a particular constituency is to calculate the proportion of SOAs in each constituency which lie within the top 10 per cent most deprived SOAs in Northern Ireland (Table 2 and Figure 1).
Table 2: Proportion of SOAs in each PC which lie within top 10 percent of most deprived SOAs in NI, 2017
|
Constituency |
Total No. of SOAs |
SOAs in top 10 per cent most deprived (%) |
| Belfast West | 50 | 46.0% |
| Foyle | 54 | 31.5% |
| Belfast North | 58 | 31.0% |
| Upper Bann | 54 | 13.0% |
| Newry and Armagh | 50 | 10.0% |
| West Tyrone | 42 | 9.5% |
| Belfast East | 46 | 8.7% |
| East Londonderry | 50 | 6.0% |
| Belfast South | 58 | 5.2% |
| Fermanagh S. Tyrone | 41 | 2.4% |
| East Antrim | 45 | 2.2% |
| North Antrim | 52 | 1.9% |
| South Down | 52 | 1.9% |
| Strangford | 52 | 1.9% |
| Lagan Valley | 48 | 0.0% |
| Mid Ulster | 43 | 0.0% |
| North Down | 46 | 0.0% |
| South Antrim | 49 | 0.0% |
For each of the 18 constituencies, Table 2 shows the total number of SOAs in the constituency and the proportion (%) which lie within the top 10 per cent of the most deprived SOAs in Northern Ireland on the overall NIMDM 2017 measure. Figure 1 displays the same information, this time in a graphical format.
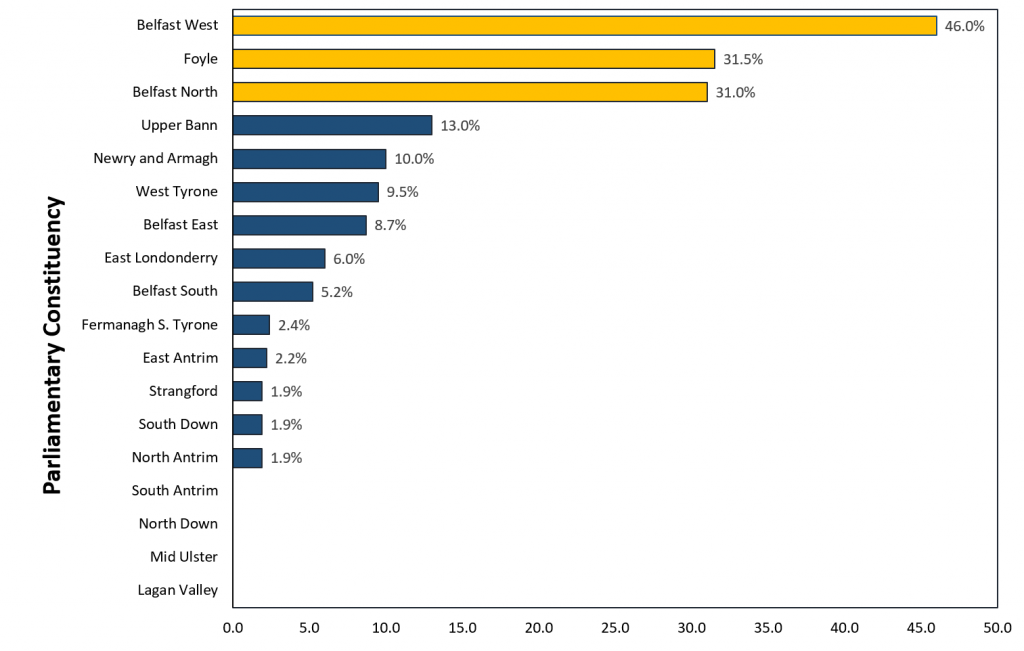
Using this indicator, Table 2 and Figure 1 clearly demonstrate that Belfast West is the most deprived constituency in Northern Ireland. It contains 50 SOAs, almost half of which (46%) are nested within the top 10 per cent most deprived SOAs in Northern Ireland. Foyle is next (32%), followed by Belfast North (31%). At the other end of the distribution, there are four constituencies where none of their SOAs are within the top 10 per cent of SOAs in the region. These are Lagan Valley, Mid Ulster, North Down and South Antrim. This does not mean, of course, that deprivation is absent from these constituencies.
Conclusion
This post has introduced the recently updated Northern Ireland Multiple Deprivation Measure (NIMD 2017), and presented some general findings at the Northern Ireland and parliamentary constituency levels. To view the results in more detail click here.