Menu
Menu
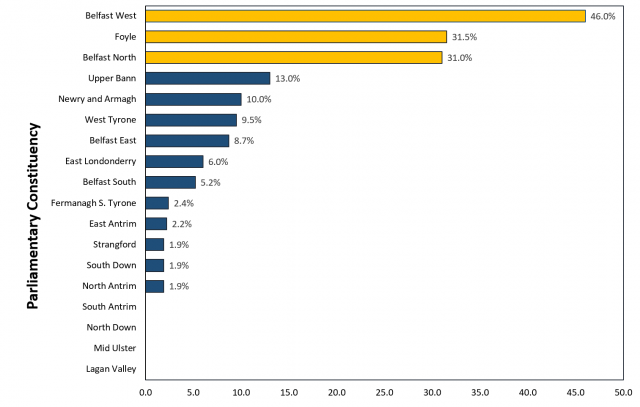
Figure 1: Proportion of SOAs in each PC which lie within top 10 percent of most deprived SOAs in NI, 2017
Reading Time: < 1 minute
Contact
Research and Information Service
Northern Ireland Assembly
Ballymiscaw
Stormont
Belfast
BT4 3XX
Phone: 028 9041 8320
Subscribe
Find out how to subscribe to this blog and receive notifications of new posts by email.
Please read our privacy notice to see how we handle your data before subscribing to the blog.


