This paper presents a brief demographic profile of Northern Ireland, updating a previous article on this subject in 2016. It shows emerging trends in the population, and comparisons with other UK countries, Ireland, and the EU. The data is largely drawn from 2017.
Growing older: Demographic change in Northern Ireland
Just before the Great Famine in 1841, the population of Northern Ireland stood at 1.65 million. It fell steadily thereafter, reaching its lowest point in 1891 (1.24 million). Due to continuous migration, the population flatlined for the following sixty years until 1951, when it made a modest recovery to 1.37 million. Census 1991 recorded a population of 1.57 million, which grew to 1.68 million by 2001, just above the pre-famine figure. In 2017, the population stood at 1.87 million, and is projected to reach 1.92 million by 2024, with the 2 million milestone being reached by mid-2040.
Population growth, however, has not been evenly spread, with the largest increases occurring in the older age bands. Between 2007 and 2017, the pension age population (aged 65+) rose by a quarter (25 per cent) to 303,000, while the number of residents aged 85+ increased by a third (33 per cent) to 37,000 (Fig 1).
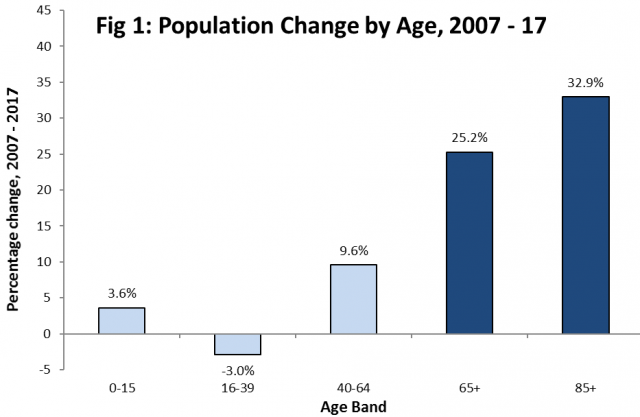
These trends are expected to continue in the coming decades: the latest projections (published in 2017) suggest that the 85 year+ population will reach 48,000 in 2026 and 73,000 by 2036. A further indication of the ageing of the Northern Ireland population lies in the relationship between the number of births and the number of 85+ residents. In mid-1999, the estimated number of people aged 85 and over was similar to the number of births in that year, while by mid-2033 there is projected to be almost three times as many people aged 85 and over than the number of births. The average (median) age of the population, which was 38.5 years in 2017, is projected to reach 40.9 years in 2027 and 42.1 years by 2032.
In brief, the Northern Ireland population is growing older. The changing age structure has largely resulted from natural change (the difference between the number of births and deaths). However, since 2004, net migration, particularly from the EU Accession countries, has also been a contributory factor.
Prior to 2004, population increase in Northern Ireland was mostly due to natural change (more births than deaths). However, in the year 2006–2007 the contribution from migration was greater than the contribution from natural change. From mid-2008 onwards, natural change reasserted itself as the dominant factor in population growth. Overall, during the full period 2004–2017, natural change accounted for 80 per cent of population growth in Northern Ireland, with net migration and other factors accounting for the remainder.
Population density
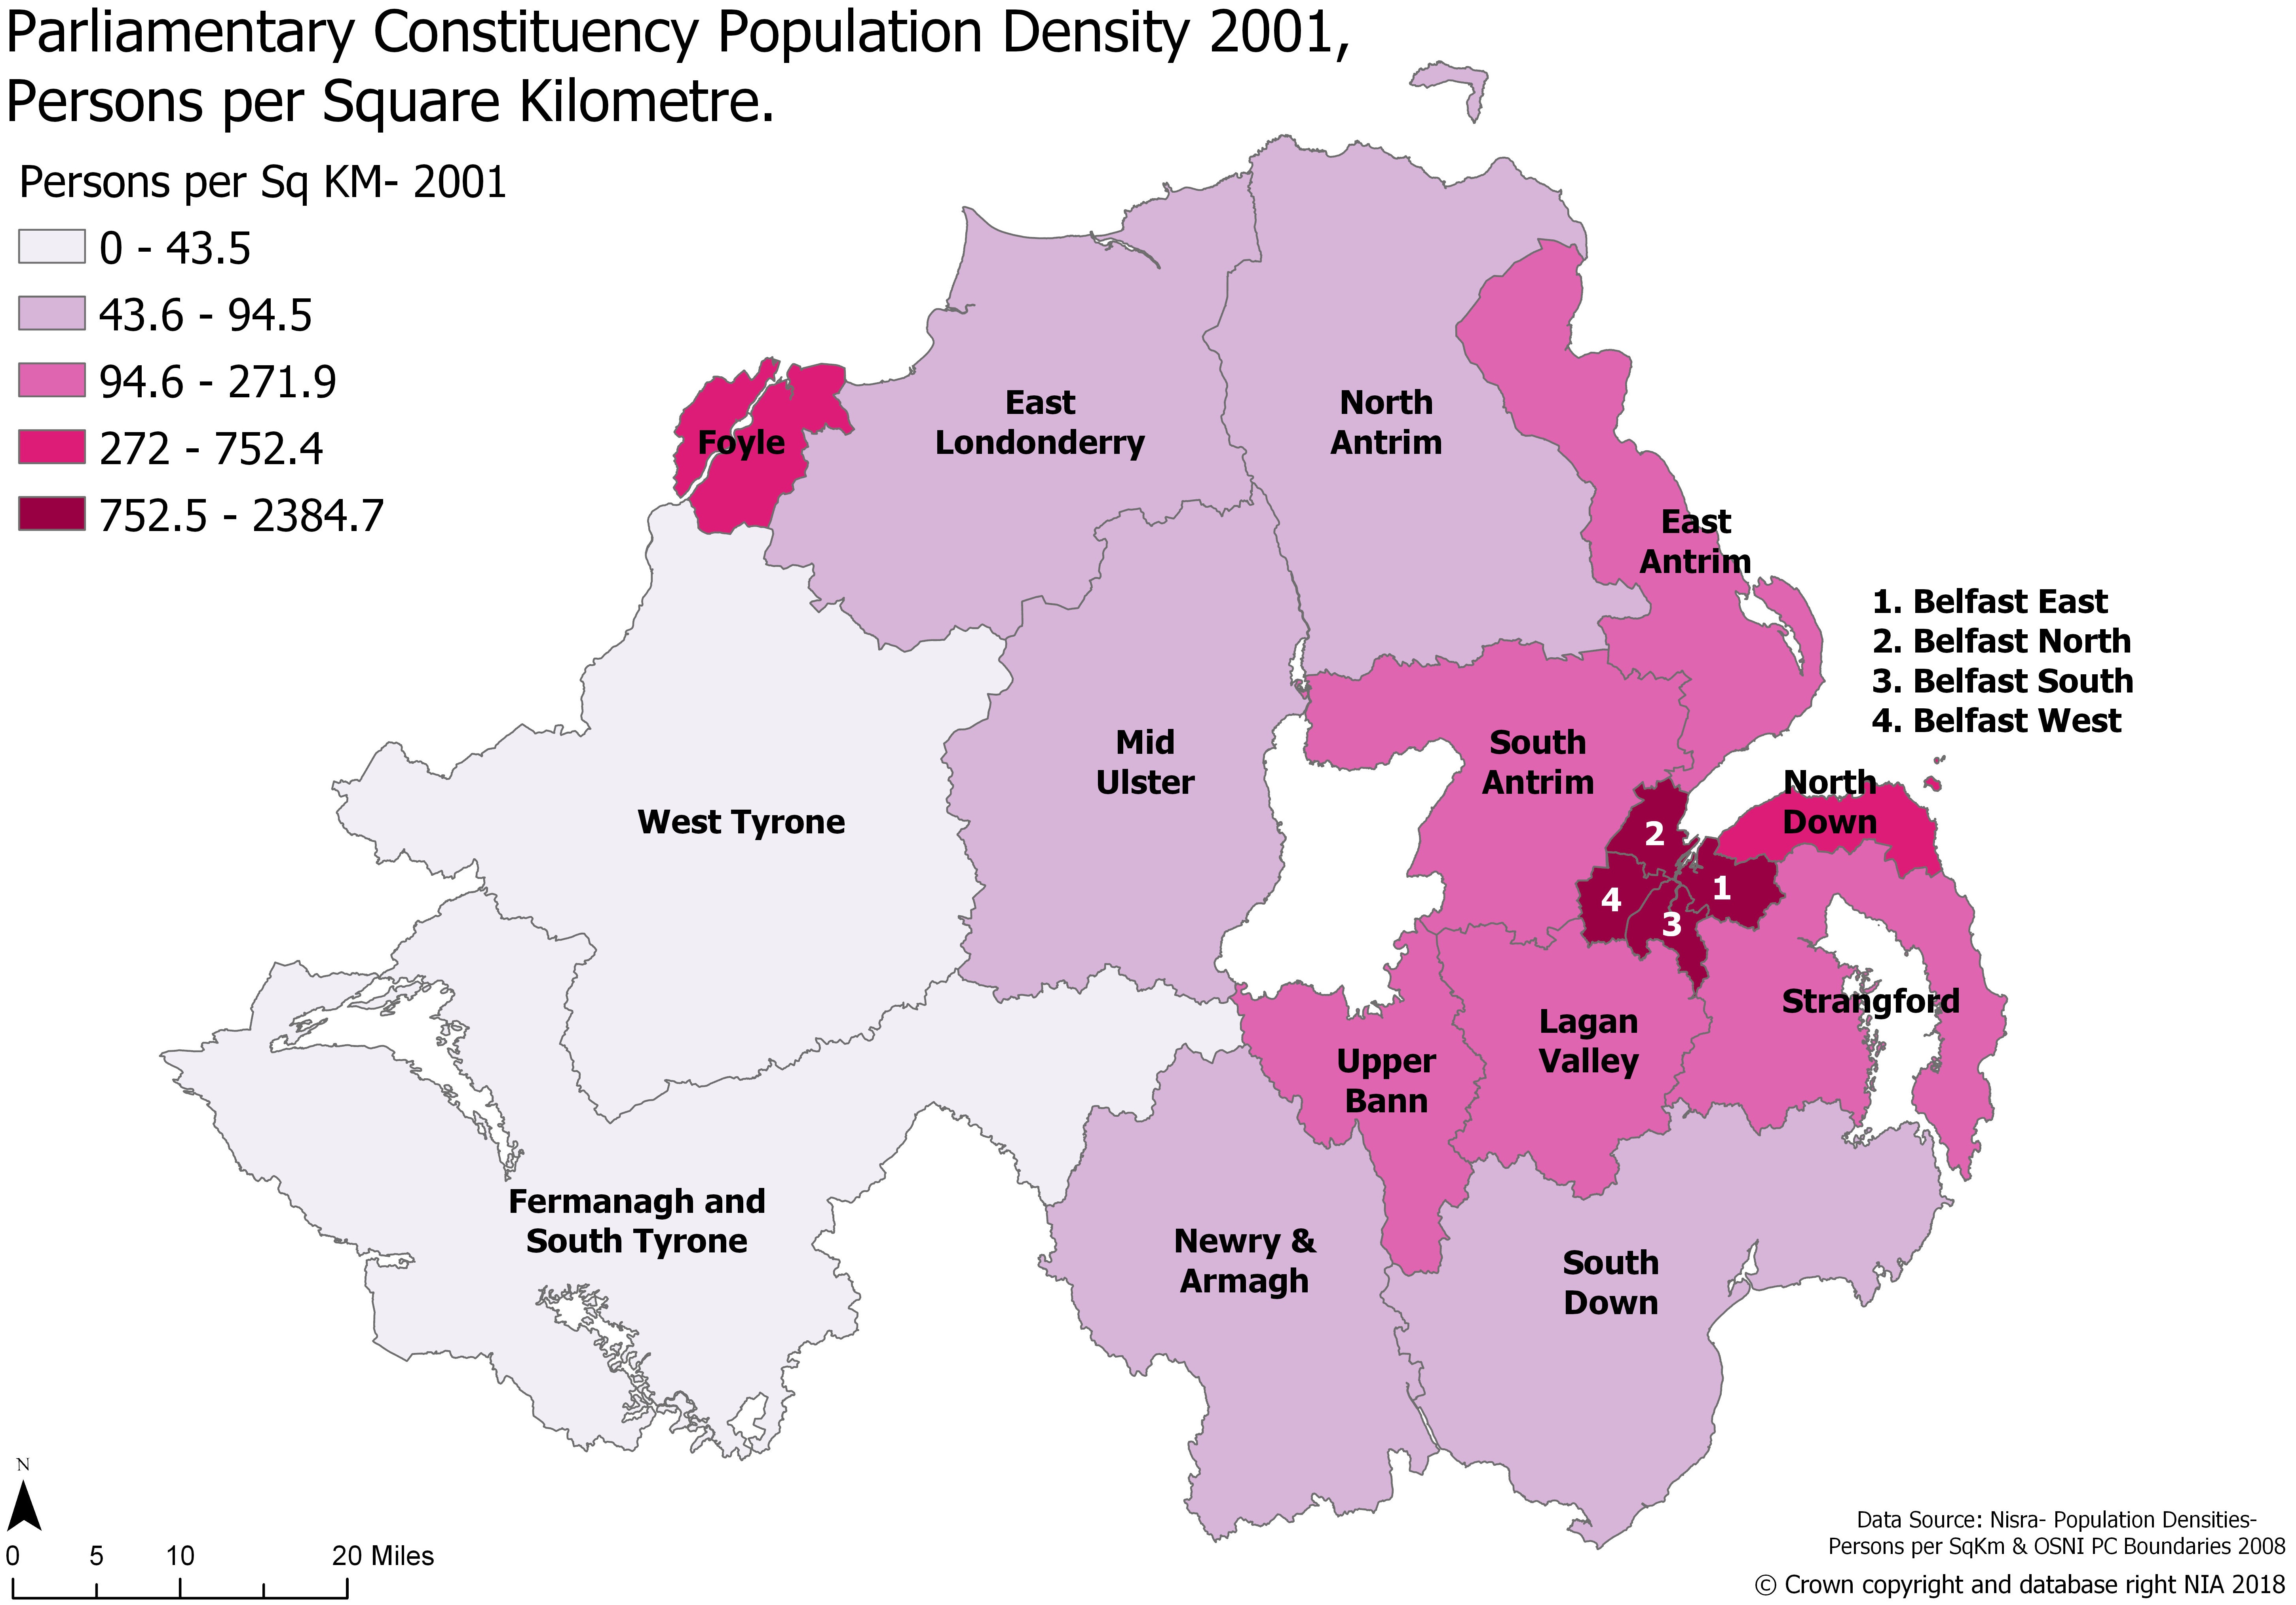
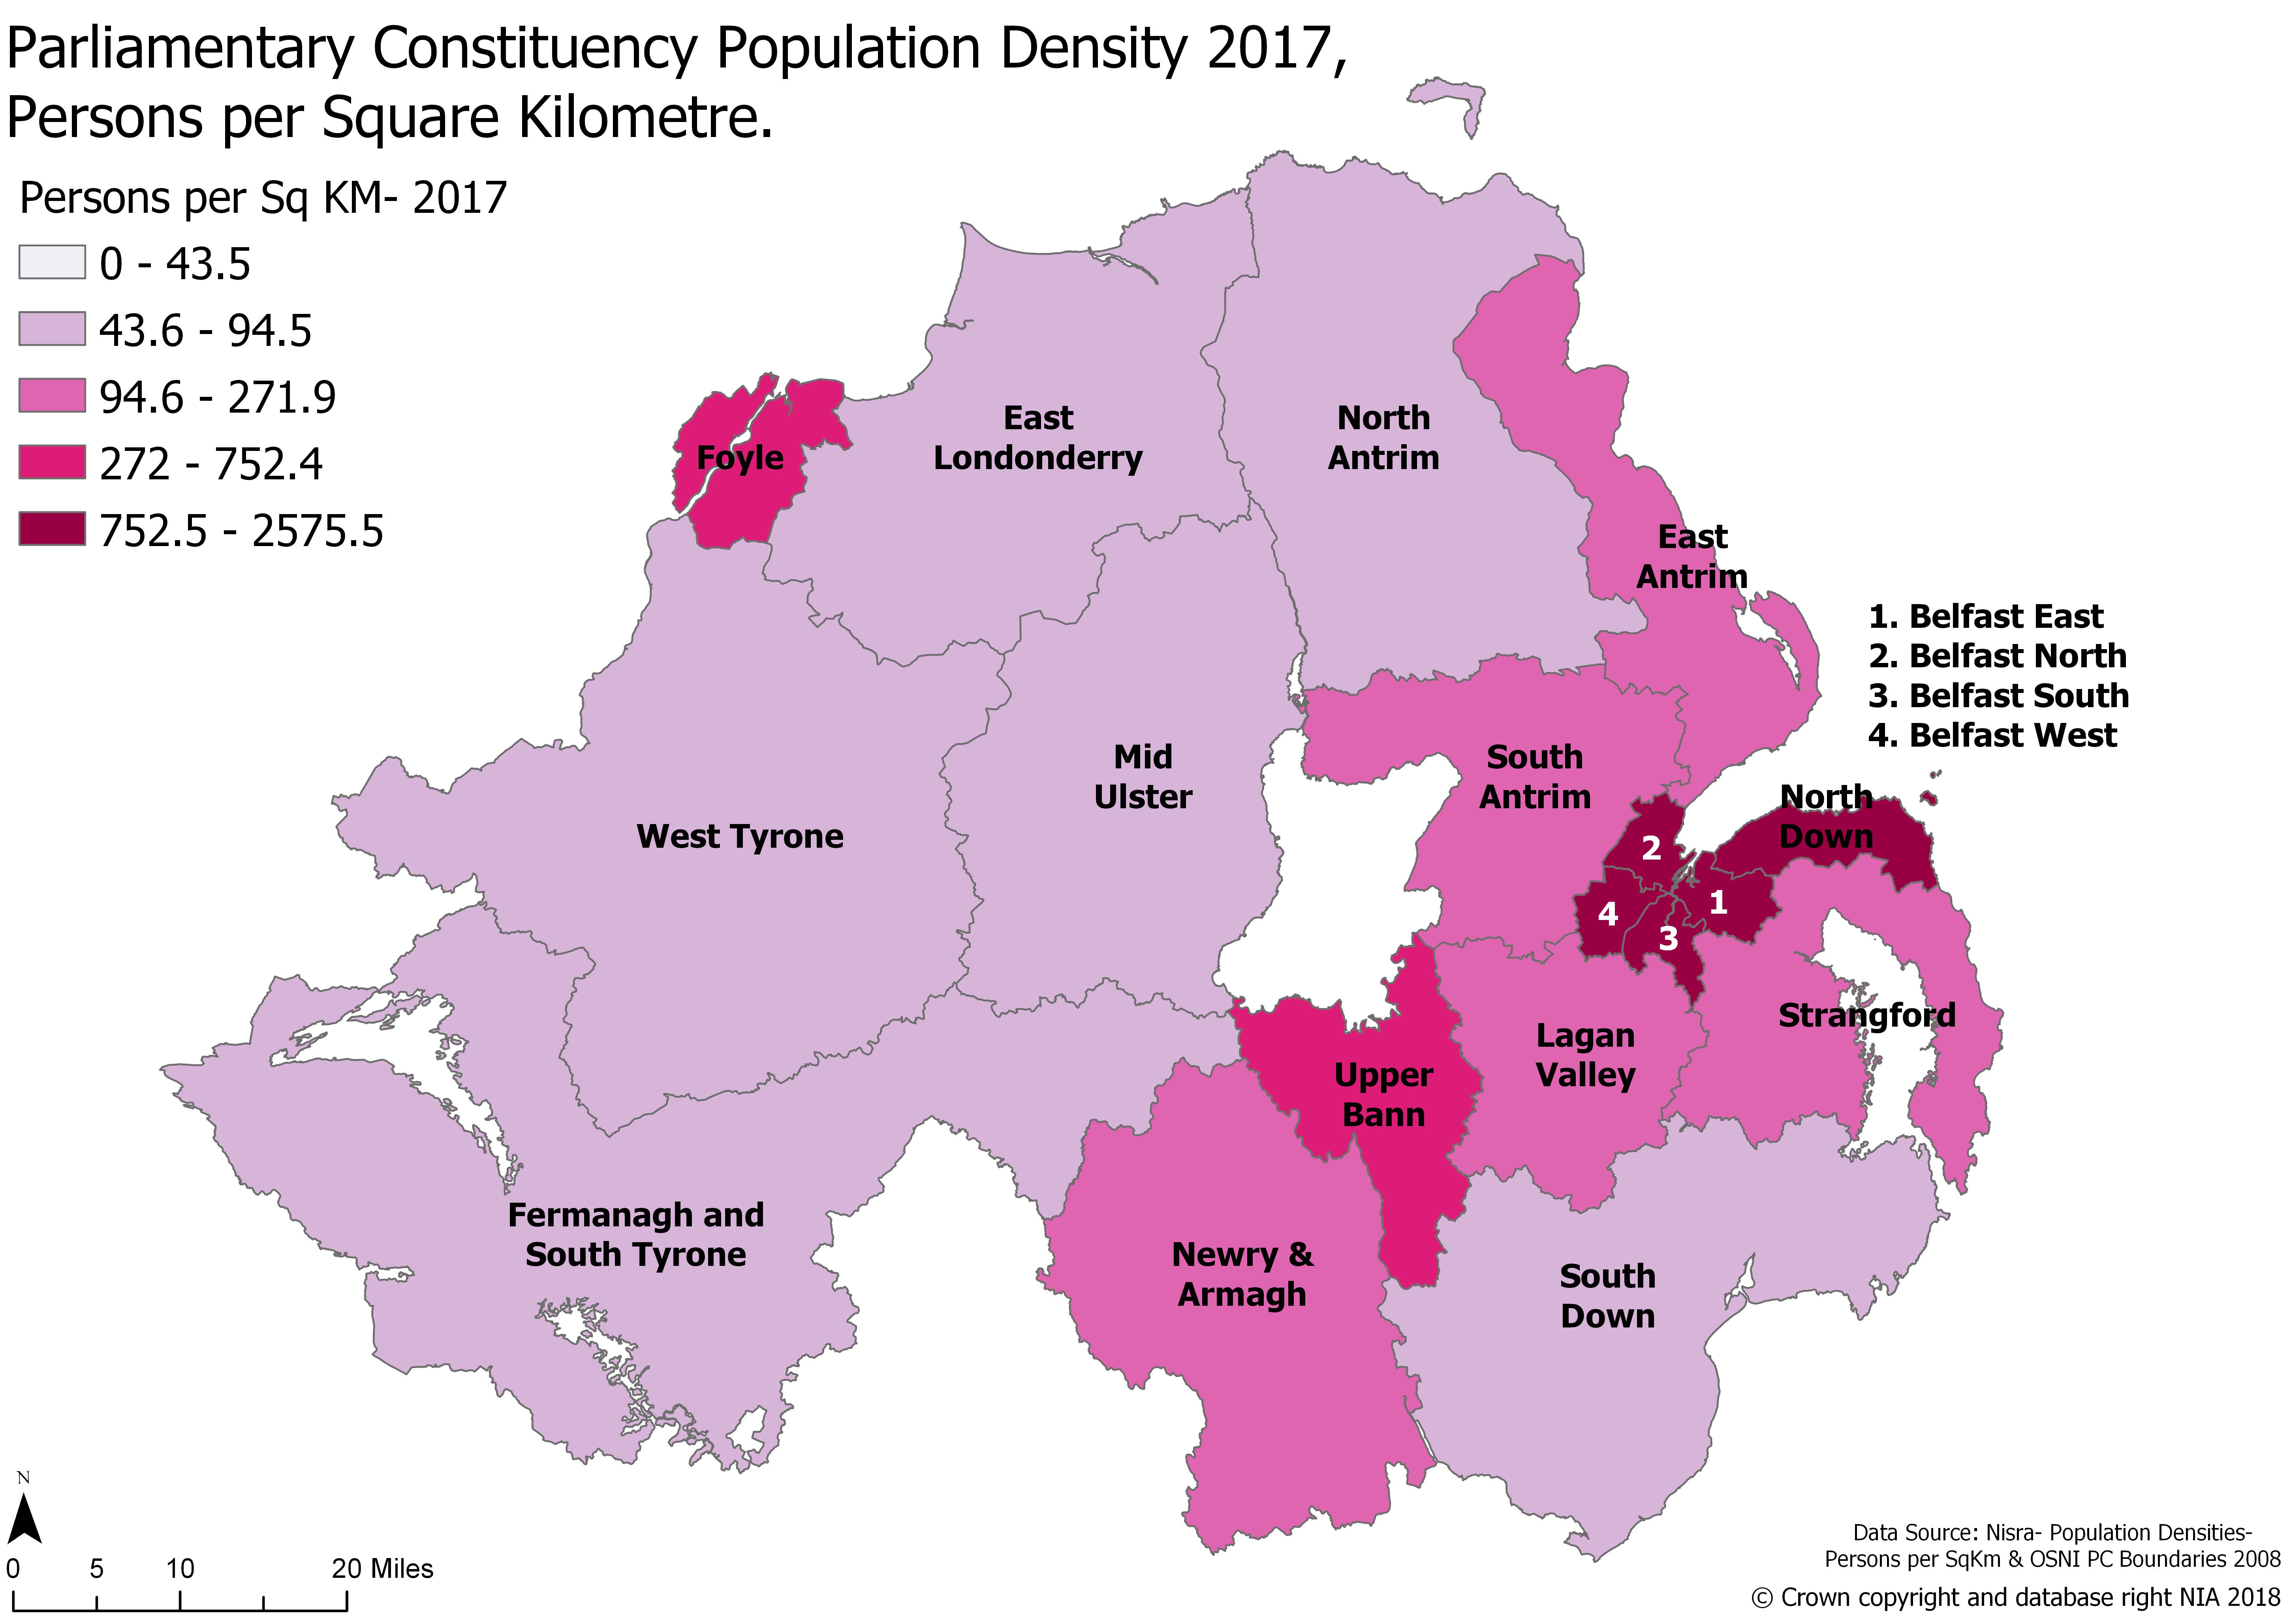
In 2001, the population of Northern Ireland stood at 1.69 million. By 2017, this figure had risen to 1.87 million, an increase of 182,000 persons (10.8 per cent). The growth in population over the past sixteen years is reflected in the population density of parliamentary constituencies (see Table 1 and Maps 1 and 2).
The largest percentage change in population densities occurred in the constituencies of Upper Bann (22%), Mid Ulster (20%), Fermanagh & South Tyrone (18%), Lagan Valley (18%), plus Newry and Armagh (17%) and South Down (17%). These constituencies, which are predominately in the west and south of Northern Ireland, have experienced significant levels of international migration in recent years, notably from central and eastern Europe. In contrast, the constituencies of Foyle (3.8%), Belfast West (-0.1%) and Belfast North (-0.3%) have had either a modest increase or small decline in population density since 2001.
Table 1: Change in population densities (persons per square kilometre), 2001–2017
| Parliamentary Constituency | 2001 | 2017 | % change |
| Upper Bann | 271.9 | 332.2 | 22.2 |
| Mid Ulster | 71.0 | 85.0 | 19.7 |
| Fermanagh & South Tyrone | 38.9 | 46.0 | 18.3 |
| Lagan Valley | 195.6 | 231.2 | 18.2 |
| Newry & Armagh | 94.5 | 110.6 | 17.0 |
| South Down | 78.9 | 92.2 | 16.9 |
| South Antrim | 143.2 | 164.5 | 14.9 |
| North Antrim | 70.6 | 80.9 | 14.6 |
| Strangford | 161.4 | 174.7 | 8.2 |
| Belfast South | 2,384.7 | 2,575.5 | 8.0 |
| West Tyrone | 43.5 | 46.8 | 7.6 |
| East Londonderry | 74.5 | 79.8 | 7.1 |
| East Antrim | 146.7 | 155.7 | 6.1 |
| Belfast East | 1,682.8 | 1,784.9 | 6.1 |
| North Down | 752.4 | 796.8 | 5.9 |
| Foyle | 565.2 | 586.4 | 3.8 |
| Belfast West | 2,098.7 | 2,097.2 | -0.1 |
| Belfast North | 2,217.3 | 2,211.6 | -0.3 |
Maps 1 and 2: Population densities (persons per square kilometre) by Parliamentary Constituencies, 2001–2017
For a further breakdown of Northern Ireland’s population change, please refer to the following mapping application which depicts percentage population change between 2001 and 2017 at Super Output Area (SOA) level:
Comparisons with other UK countries, Ireland and EU-28
Table 2 presents a number of key demographic comparisons between Northern Ireland and the other UK countries. The table reveals that Northern Ireland:
- had the second fastest growing population in the UK between 2007 and 2017 (6.2 per cent increase);
- has the youngest population in the UK (average age, 38.5 years in 2017);
- has the highest fertility rate in the UK (1.97 births per woman in 2017). By 2025, the rate is projected to fall to 1.94, still higher than any other UK country; and
- has the lowest death rate (8.6 per thousand population in 2017) of any UK jurisdiction.
Table 2: Northern Ireland: Comparisons with other UK Jurisdictions
| United Kingdom | England | Wales | Scotland | Northern Ireland | |
| POPULATION (millions, rounded) | |||||
| 2007 (estimate) | 61.3 | 51.4 | 3.0 | 5.2 | 1.8 |
| 2017 (estimate) | 66.0 | 55.6 | 3.1 | 5.4 | 1.9 |
| 2025 (projection) | 68.9 | 58.2 | 3.2 | 5.6 | 1.9 |
| Percentage change, 2007-17 | 7.7% | 8.2% | 4.0% | 4.9% | 6.2% |
| MEDIAN AGE (years) | |||||
| 2017 | 40.1 | 39.8 | 42.5 | 42.0 | 38.5 |
| 2025 (projection) | 41.2 | 41.0 | 42.9 | 42.6 | 40.4 |
| TOTAL FERTILITY RATES (children per woman) | |||||
| 2017 | 1.82 | 1.83 | 1.78 | 1.62 | 1.97 |
| 2025 (projection) | 1.80 | 1.81 | 1.81 | 1.56 | 1.94 |
| DEATHS (crude rate per thousand population) | |||||
| 1984 | 11.4 | 11.3 | 12.0 | 12.1 | 10.1 |
| 2017 | 9.2 | 9.0 | 10.6 | 10.7 | 8.6 |
Sources: NISRA, ONS
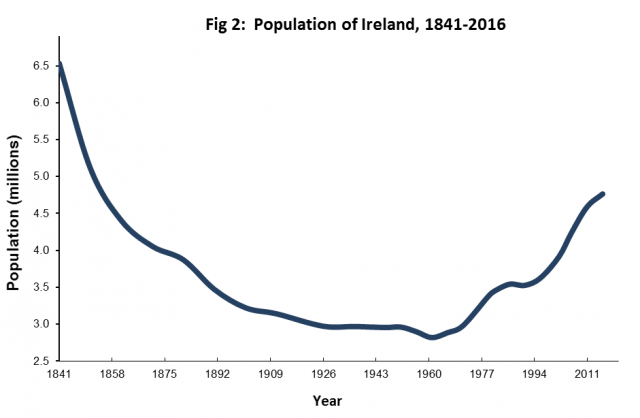
The population of the Republic of Ireland went into a steep decline for over a century after the Great Famine, reaching a low point of 2.8 million in 1961 (Fig 2). However, since the early 1990s, both natural increase and significant net international migration have contributed to record population growth, with the result that the 2006 population of 4.24 million was the highest recorded since 1871. A figure of 4.76 million was recorded in the latest Census (April 2016), and the population of the State is projected to rise to 5.19 million by 2031.
Although the Republic of Ireland (average age, 37.4 years in 2016) currently has the youngest population in the EU-28, the number of older people (aged 65+) is projected to rise substantially over the next decade.
EU-28
Changing fertility, life expectancy and migration will significantly alter the age structure of the EU population in the coming decades. The total population of the EU-28 was provisionally estimated to be 512.6 million at 1 January 2018, compared with 511.5 million in January 2017, an increase of 1.1 million. The increase was primarily due to net migration, rather than natural change (births and deaths).
The EU-28 population is projected to peak at 529 million by 2045, declining thereafter to 519 million by 2080. Again, trends in the EU-28 are broadly similar to those of the UK and Ireland, i.e. a progressively ageing population. While Europeans are living longer than ever before, they are having fewer children. This means the proportion of retired and elderly people will rise over the next few decades, while the proportion of working-age people will fall.
Implications of ageing population for spending on health and pensions
As the baby boomer generations, born between the late 1940s and early 1960s, approach retirement across Europe, there will be important consequences for public expenditure. Two of the spending areas most likely to be affected are health and pensions.
The relationship between ageing and healthcare costs is not linear. Whilst it is true that older people consume more health services per head than any other group, healthcare expenditure increases rapidly only in the latter days of life. In particular, it is proximity-to-death that tends to increase costs, rather than age per se. According to the latest projections, the number of deaths (16,000 in 2017) is expected to rise gradually in the coming decades, reaching 20,000 per year by 2040. This suggests that healthcare costs in Northern Ireland associated with approaching death are likely to increase in line with the growing number of deaths.
The impact on pension provision of the sharp increase in the projected number of older people in Northern Ireland is likely to be modified by a number of factors. For example, the abolition of the Default Retirement Age (DRA), the gradual rise in state pension age, and the growing tendency for older people to work beyond retirement age will, to some extent, mitigate the projected number of pensioners and their associated costs.