
Overview
The latest figures published by the Northern Ireland Statistics and Research Agency (NISRA) (February 2021) show that the number of alcohol-specific deaths in 2019 was the highest ever recorded, with 336 registered deaths linked to alcohol-specific causes. This note examines deaths linked to alcohol consumption in Northern Ireland, and compares the figures with those of other UK jurisdictions.
The number of alcohol-related deaths in 2019 was over a third (35%) more than was reported in 2011 (249), and 18% higher than the 2018 total of 284. Alcohol-specific deaths (i.e. deaths resulting from health conditions linked to alcohol misuse), account for approximately two percent of all deaths registered each year in Northern Ireland.
Gender
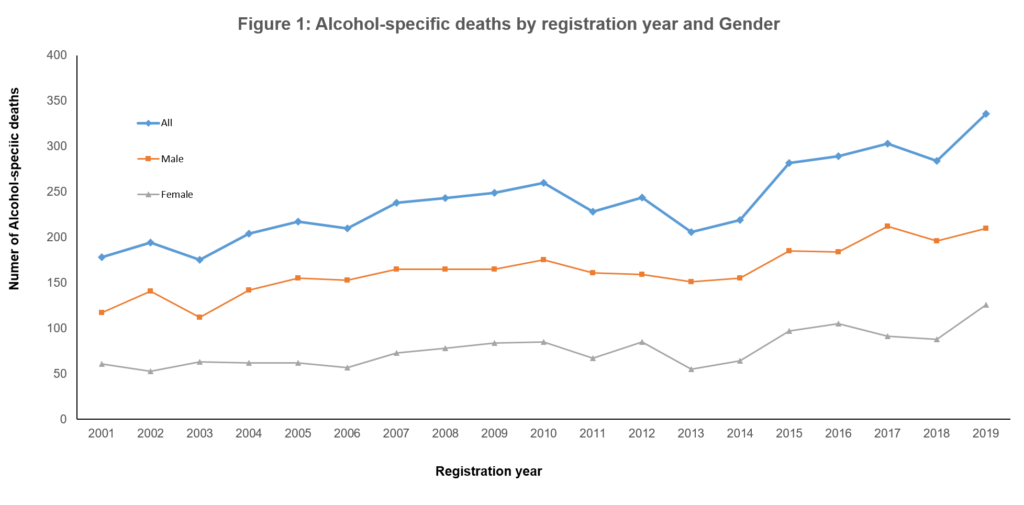
Table 1 and Figure 1 present the number of alcohol-specific deaths by gender each year between 2001 and 2019, plus the corresponding rate per 100,000 population. The figure illustrates the general upward trend in deaths and death rates for both genders since the Millennium. Between 2018 and 2019, the male mortality rate increased from 21.2 per 100,000 males to 22.5, while the female rate rose from 9.2 per 100,000 to 13.1 (Table 1).
Table 1: Alcohol-specific deaths and death rates (per 100,000), 2001–2019
| Deaths | Rate | |||||
| Year | All | Male | Female | All | Male | Female |
| 2001 | 178 | 117 | 61 | 10.5 | 14.2 | 7.1 |
| 2002 | 194 | 141 | 53 | 11.4 | 17.0 | 6.1 |
| 2003 | 175 | 112 | 63 | 10.3 | 13.4 | 7.2 |
| 2004 | 204 | 142 | 62 | 11.9 | 16.9 | 7.1 |
| 2005 | 217 | 155 | 62 | 12.6 | 18.3 | 7.0 |
| 2006 | 210 | 153 | 57 | 12.0 | 17.9 | 6.4 |
| 2007 | 238 | 165 | 73 | 13.5 | 19.1 | 8.1 |
| 2008 | 243 | 165 | 78 | 13.7 | 18.9 | 8.6 |
| 2009 | 249 | 165 | 84 | 13.9 | 18.8 | 9.2 |
| 2010 | 260 | 175 | 85 | 14.4 | 19.8 | 9.2 |
| 2011 | 228 | 161 | 67 | 12.6 | 18.1 | 7.2 |
| 2012 | 244 | 159 | 85 | 13.4 | 17.8 | 9.1 |
| 2013 | 206 | 151 | 55 | 11.3 | 16.8 | 5.9 |
| 2014 | 219 | 155 | 64 | 11.9 | 17.2 | 6.8 |
| 2015 | 282 | 185 | 97 | 15.2 | 20.3 | 10.3 |
| 2016 | 289 | 184 | 105 | 15.5 | 20.1 | 11.1 |
| 2017 | 303 | 212 | 91 | 16.2 | 23.0 | 9.6 |
| 2018 | 284 | 196 | 88 | 15.1 | 21.2 | 9.2 |
| 2019 | 336 | 210 | 126 | 17.7 | 22.5 | 13.1 |
Source: NISRA (February 2021)
In 2019, 210 (62.5%) of the alcohol-specific deaths were male and 126 (37.5%) were female. This is the highest annual number of female alcohol-specific deaths recorded in Northern Ireland.
Age
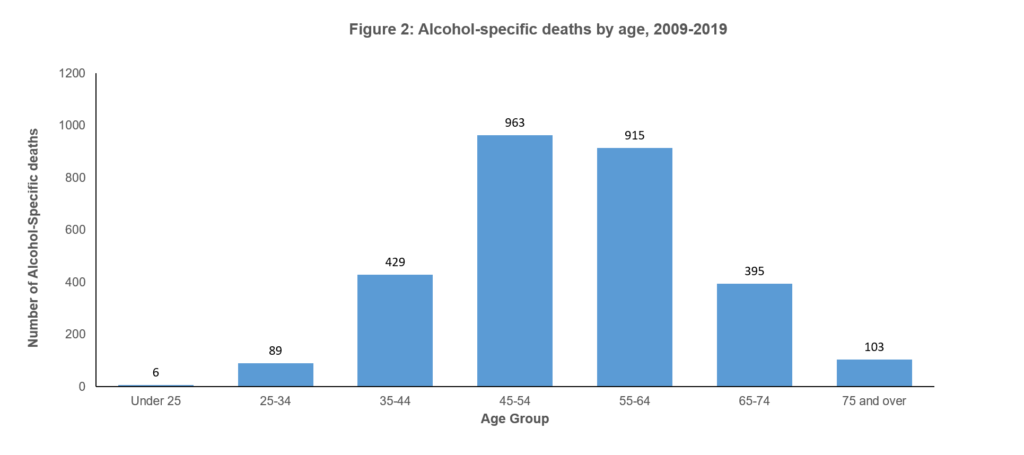
Table 2 and Figure 2 show the total number of alcohol-specific deaths by age band in Northern Ireland during the period 2009–2019. It shows that almost two-thirds (64.8%) of all such deaths occurred in the 45-54 and 55-64 age bands, a total of 1,878 out of 2,900 fatalities. The median (average) age of death during the decade was 54 years.
Table 2: Alcohol-specific Deaths in Northern Ireland, 2009 – 2019
| Age |
Total |
Rate per 100,000 pop. |
% of Alcohol- specific Deaths |
| All Deaths | 2,900 | 14.3 | |
| Under 25 | 6 | 0.1 | 0.2 |
| 25-34 | 89 | 3.3 | 3.1 |
| 35-44 | 429 | 15.9 | 14.8 |
| 45-54 | 963 | 34.3 | 33.2 |
| 55-64 | 915 | 40.4 | 31.6 |
| 65-74 | 395 | 22.8 | 13.6 |
| 75 and over | 103 | 7.4 | 3.6 |
| Median Age | 54 |
Deprivation
Figure 3 draws on statistics from the 2017 Northern Ireland Multiple Deprivation Measure (NIMDM). It illustrates alcohol-specific death rates through the lens of deprivation. Looking at the most recent five years (2015–2019), there are notably higher numbers of alcohol-specific deaths in areas of higher deprivation across Northern Ireland (Fig 3), with the death rate in the most deprived areas (30.3 deaths per 100,000 population) being over three times higher than that in the least deprived areas (8.3 deaths per 100,000 population).
N.B. For the purposes of this exercise, the 890 Super Output Areas (SOAs) in Northern Ireland are ranked from most deprived to least deprived, then divided into five equal quintiles (20%).

Comparisons with other UK jurisdictions
In 2019, Northern Ireland had the highest alcohol-specific death rate of all four UK nations, with 18.8 deaths per 100,000, although the difference between Northern Ireland and Scotland was not statistically significant (see Table 3 and Figure 4). England and Wales continue to have lower rates, with 10.9 and 11.8 deaths per 100,000 people respectively.
Table 3: Alcohol-specific Death Rates: UK Comparison 2001 – 2019
| England | Scotland | Wales | NI | |
| 2001 | 8.9 | 26.1 | 10.1 | 12.4 |
| 2003 | 9.6 | 28.3 | 10.3 | 12.1 |
| 2005 | 10.1 | 27.6 | 11.2 | 14.2 |
| 2007 | 10.6 | 25.5 | 12.8 | 15.0 |
| 2009 | 10.4 | 23.0 | 12.9 | 15.5 |
| 2011 | 10.9 | 21.9 | 12.4 | 13.9 |
| 2013 | 10.2 | 19.0 | 12.7 | 12.2 |
| 2015 | 10.3 | 19.5 | 11.9 | 16.4 |
| 2017 | 11.1 | 20.5 | 13.5 | 17.4 |
| 2019 | 10.9 | 18.6 | 11.8 | 18.8 |
N.B. Table 3 and Figure 4 show the age-standardised death rates for all four UK nations. Age adjusting rates is a way to make fairer comparisons between groups with different age distributions, as would be the case for England, Scotland, Wales and Northern Ireland. The rates are standardised to the European standard population 2013.
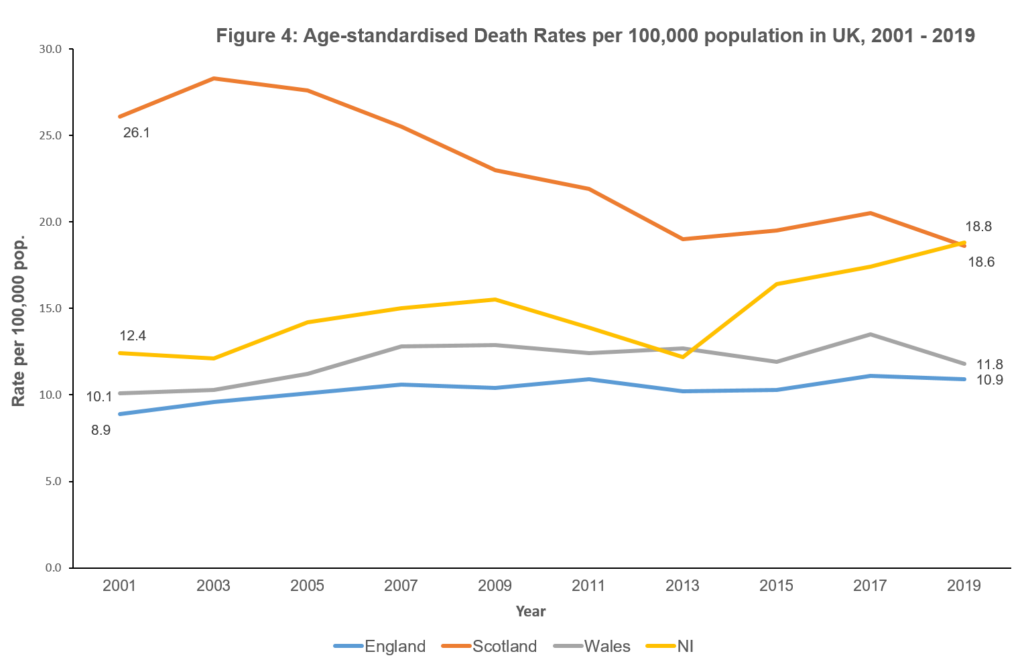
Since 2001, age-standardised rates of alcohol-specific deaths in Scotland have consistently been the highest of the four UK nations, peaking at 28.5 deaths per 100,000 in 2006 (Figure 4). Since then, the mortality rate has fallen by more than a third to 18.6 deaths per 100,000 in 2019. In contrast, the alcohol-specific mortality rate in Northern Ireland has risen from 12.4 deaths per 100,000 in 2001 to 18.8 in 2019, with a notable increase since 2013. While not affecting earlier figures, it may be worth noting that a minimum unit pricing policy was implemented by the Scottish Government on 1 May 2018, while a similar policy was also introduced in Wales on 2 March 2020. Scotland remains the only UK jurisdiction to show a statistically significant improvement compared with 2001 rates.
Summary
This note has reviewed deaths linked to alcohol consumption in Northern Ireland, and compared the figures with those of other UK jurisdictions. In 2019, Northern Ireland had not only the highest number of deaths (336) recorded since the series began in 2001, but also the highest age-standardised mortality rate of all four UK nations. The male death rate is consistently higher than the female death rate, with nearly two-thirds (62.5%) of alcohol-specific deaths in 2019 occurring in males. During the decade 2009–2019, almost two-thirds (64.8%) of alcohol-specific deaths occurred in the 45-54 and 55-64 age bands, a total of 1,878 out of 2,900 fatalities. The median (average) age of death from alcohol-specific causes during the decade was 54 years. Mortality from alcohol is linked to poverty, with the death rate in the most deprived areas of Northern Ireland (30.3 deaths per 100,000 population) being over three times higher than that in the least deprived areas (8.3 deaths per 100,000 population).