Transport trends during the COVID-19 pandemic in Northern Ireland

Share
Reading Time: 8 minutes

Transport trends during the COVID-19 pandemic in Northern Ireland

An image of the centre of Belfast with buses whizzing past COVID-19 signs
Image by Rossographer, used under CC BY-SA 2.0

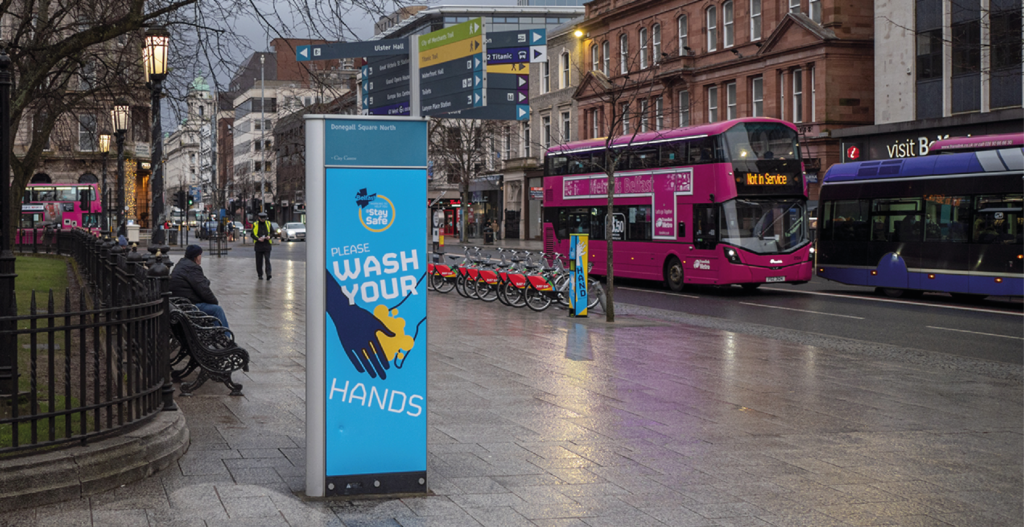
In March 2020, the lockdown imposed in response to the COVID-19 pandemic triggered a collapse in the use of all modes of transportation in Northern Ireland (NI). At the height of the pandemic, public transport use dropped by more than 90%, whilst road traffic flow dropped by almost 80%.

A Research Matters blog article, published in May 2020, discussed how COVID-19 might change our travel behaviour. This blog article will examine the impact of COVID-19 on travel habits, current transport trends in NI and discuss possible recovery options.

Pre-COVID transport habits in Northern Ireland

NI is a hugely car dependent society with over 70% of journeys in NI being made by car pre-COVID-19. In addition, 87% of journeys of one mile or over are made by car. This is reflected by the high levels of car ownership in NI; 81% of all households have access to a car. A significant cause of this dependence on cars is the large and growing rural population, with 36% of the NI population living in rural areas.

Public transport accounts for just over 5% of journeys made in NI (see Figure 1,below). Increasing public transport use and active travel (making journeys by walking or cycling) have been long term policy objectives since the publication of the first Regional Transportation Strategy (RTS) in 2002. However, NI has the lowest per capita spend on public transport in the UK.

In contrast to car ownership, 65% of households in NI do not own a bicycle. A survey carried out by the Department for Infrastructure (DfI) on active and sustainable travel in 2019-2020 found that 31% of males and 16% of females had cycled in the past four weeks. This survey also reports that around 50% of people were not satisfied with current provisions for cyclists and cycling in their local area.

How COVID-19 impacted transport trends in Northern Ireland

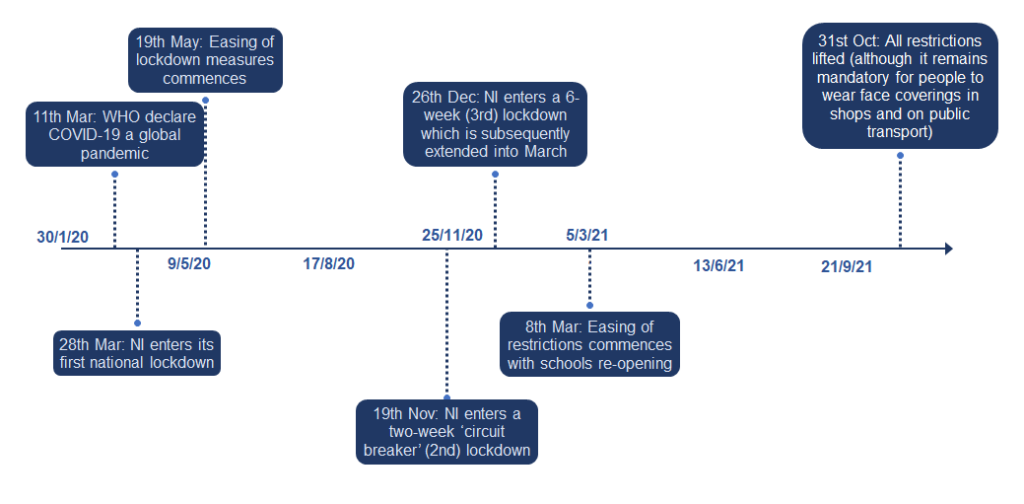
Figure 2 displays a timeline of key COVID-19 dates in NI.

A timeline showing the key dates on the COVID-19 timeline for Northern Ireland so far
Figure 2: Key COVID-19 dates in Northern Ireland

The NI Executive’s responses to COVID-19 are reflected in transport data provided by the DfI. Figure 3 displays weekly average traffic flow for all major roads in NI and monthly average public transport patronage as a percentage compared to a pre-COVID-19 baseline from March 2020 to June 2021. The pre-COVID-19 baseline for traffic flow is taken as an average of traffic flow from February/March 2018/2019, whilst for public transport patronage it is an average of February/March 2019 for each mode of public transport.

The following trends can be observed in Figure 3:

  • Public transport drops more substantially than traffic flow by April 2020: 90-98% reduction compared to the pre-COVID-19 baseline compared to 70-80%, respectively. Rail had the greatest reduction in use out of all modes of public transport.
  • From mid-April 2020, traffic flow began to increase and had hit 10% lower than the pre-COVID-19 baseline by September 2020. This figure can be compared to -40-60% for public transport patronage.
  • Traffic flow dropped substantially in December 2020, hitting a trough of around 60% reduction compared to pre-COVID-19 levels. Whereas public transport patronage hit a trough in January 2021 of 70-90% reduction compared to pre-COVID-19 levels.
  • There are upward trends in the use of both modes of transport from February 2019. By June 2021, weekend traffic flow had returned to pre-COVID levels whilst weekday traffic flow returned to 5% lower than pre-COVID levels. Public transport patronage was still 25-50% below pre-COVID-19 levels.
  • Rail patronage has had the worst recovery compared to other modes of public transport (-51%) whereas the Glider buses have had the best recovery (-25%).

Figure 4 is an interactive heat map to show monthly average traffic flow on major roads across NI as a percentage difference to a pre-COVID-19 baseline (average traffic flow in February/March 2019 for each road) from January 2019 to June 2021. It is running on a loop. Data is missing in January and February 2020. The bigger and darker the circle, the greater the traffic flow and smaller difference to the pre-COVID-19 baseline. The smaller and lighter the circle, the lower the traffic flow and greater difference to the pre-COVID-19 baseline. Double click on an area of the map to zoom in to see road names and percentage difference figures.

The general trends observed in Figure 3 can be seen in the data for each of these roads. By June 2021, all roads had recovered to at least 10% reduction of the pre-COVID-19 baseline, other than the A55 at Forestside, which remained at around 40% reduced. The A1 at Loughbrickland and Dublin Road had the most dramatic reductions in traffic flow after both lockdowns (around -70% in the first lockdown and -50% in the third lockdown). In June, the traffic flow on these roads had returned to around 2% reduction on pre-COVID levels. Crumlin Road in North Belfast had the least dramatic reduction in use following lockdowns (around -50% in the first lockdown and -30% in the third lockdown). The A4 had the greatest recovery by June 2021, to around 7% greater than pre-COVID-19 levels.

Figure 4: Northern Ireland traffic flow January 2019–June 2021

Unfortunately, there is no data following the COVID-19 outbreak on active transport in NI. For the whole of the UK, between May and September 2020, 34% of cyclists reported that they cycled more than before the pandemic, while 38% of those who walk reported they walked more than before the pandemic.

Explanation for observed trends

As seen in other societies recovering from COVID-19, the data presented here shows that traffic flow rates recovered more rapidly than public transport use. Earlier this year, the Assembly Research and Information Service conducted a survey to gather information on decarbonised transport in NI. The survey findings point to possible reasons for the trends we have observed.

Table 1 displays responses to the survey question: ‘since the start of the COVID-19 pandemic how often do you now travel by’ various modes. Some respondents indicated that they have avoided using public transport for hygiene reasons and switched to car journeys instead. Meanwhile, walking and cycling may have increased as a result of shorter journeys and the opportunity to change travel habits.

Table 1: COVID-19 travel mode changes

 Significantly lessA little lessNot at allA little moreSignificantly moreDon’t know
Car36%23%9%18%12%1%
Public transport23%5%65%2%1%4%
Other7%2%65%1%2%23%
Cycle4%4%57%20%8%5%
Walk4%5%10%48%32%2%

Respondents were asked to sum up the main way they expected their travel behaviour to change after COVID-19 restrictions are removed (see Figure 5, below). 33% expected to travel less generally. 29% expected to walk and cycle more. 22% expected to drive more. These changes may be due to lifestyle and habit changes. Most significantly, 54% expected to work from home (WFH) at least some of the time (see Figure 6).

Figure 5 shows expected travel behaviour after COVID-19.

Figure 6 shows expected frequency of WFH after COVID-19.

This survey suggests that the reduction in the use of public transport may be due to people opting for active transport methods over shorter distances, more people WFH, and people opting to use private cars over public transport due to health concerns. Given that traffic flow has returned to normal, the reduction in traffic on the roads due to people WFH is balanced out by people opting to use cars over public transport due to health concerns.

Transport behaviour during COVID-19 in other countries

COVID-19 lockdowns resulted in a dramatic reduction in transport use all over the world. These trends were recorded by Citymapper’s mobility index. A study which examined this mobility index found steep declines in mobility in almost all cities in Europe and North America from 2 March 2020.

Bus use in Great Britain, excluding London, showed an initial decline by around 90% compared to pre-COVID-19 levels. This figure recovered to a reduction of 40% in September 2020. Following a third lockdown, bus usage had reduced by around 80% and then recovered to around 40% reduction by Summer 2020.

Trends from Transport Scotland for the first year of the pandemic (March 2020 to February 2021) show similarities to NI. Trunk road traffic flow reduced by around 75% compared to pre-COVID-19 levels by April 2020. Traffic flow recovered at a faster rate compared to use of public transport following the first lockdown.

Transport funding in response to COVID-19

In 2019-2020, Translink reported a loss of £54 million compared to a £17 million loss in 2018-2019. In 2021-2022, Translink will receive an estimated £197 million capital funding. Despite this funding, early indications of Translink’s 2021-2022 budget are that they anticipate a £77 million loss with £50 million being attributed to the ongoing impact of COVID-19 on its fare income. Based on his audit of the 2020-2021 accounts of the DfI, NI’s Comptroller and Auditor General stated that:

…the ongoing funding uncertainty is a significant risk to the financial sustainability of Translink.

Some of the 2021-2022 Translink funding will go towards additional train capacity. There will also be a further funding commitment of £25 million for zero and low emission buses.

In June 2021, the Department for Infrastructure (DfI) transport minister allocated a budget of £11 million to Active Travel Investment from the £20 million Blue/Green fund, in addition to £2.5 million allocated to greenways. This is a greater investment in active travel than any previous years. However, some have criticised the DfI minister for not doing enough and are disappointed that the intention to ‘build back better’ resulted in a couple of pop-up cycle lanes in Belfast and a 1.8 km stretch of greenway near Lisburn.

Transport funding in response to COVID-19 in other countries

A £250 million emergency active travel fund for England was announced in May 2020. This was the first stage of a £2 billion investment for cycling and walking in the UK. In the UK Autumn Budget 2021, £6.9 billion has been allocated to train, tram, bus and cycle projects in English cities.

Sustrans stated that the UK hasn’t acted as quickly as other nations to improve active travel or public transport transitioning out of COVID-19 lockdowns. In April 2020 Milan, in Northern Italy, announced a plan to expand cycle lanes and walking space on 35 km of streets. Bogota is opening 80 km of roads to cyclists, while Lima in constructing 300 km of bike lanes. A Sustainability Mobility Package was announced in France which includes €400 per year, tax free, for employees who can prove the use of sustainable transport modes.

The Institution for Civil Engineers published a report in June 2021 on public transport funding post-COVID. They stated that funding models that focus on transport systems covering their operating costs should be a particular concern. With these models, governments should step in quickly to provide bailout packages with a clear transition to prevent cuts to public transport services. In 2020, two academics from the University of Melbourne published a blog post that highlighted a key lesson learned through COVID-19 is that city road space needs to be re-oriented to the advantage of buses and trams, cyclists and pedestrians.

Policy implications

As observed in other countries coming out of pandemics, the public transport patronage in NI has not recovered to pre-pandemic levels whereas traffic flow levels have. This can likely be attributed to people shifting from using public transport to private car to protect themselves against the virus. However, long term sustainability of our transport system will be based on a strong public transport system.

Reduced patronage during the pandemic has resulted in Translink facing massive financial pressures. Although there has been funding allocated to Translink to support the decarbonisation of its fleet, it is critical that funding is provided to sustain services and attract passengers back on to public transport. There may also be the opportunity post-COVID-19 to rebalance public transport policy and expenditure with a greater recognition of the potential for walking and cycling within the transport mix.

While the rapid recovery of road transport may reflect a ‘return to to normal’, it does pose a significant problem for policy makers. To offset the potential negative externalities of this trend, including increased emissions and congestion, policies to reduce travel demand (WFH) and accelerate the adoption of zero emission vehicles could be considered.


Share