
A demographic profile of Northern Ireland in 2016

Please note: we have posted a new version of this blog article using the most recent data, see here.
This article presents a brief demographic profile of Northern Ireland, showing emerging trends in the population, and comparisons with other United Kingdom (UK) countries, the Republic of Ireland, and the European Union (EU).
Growing Older: Demographic change in Northern Ireland
Just before the Great Famine in 1841, the population of the area which is now Northern Ireland stood at 1.65 million. It fell steadily thereafter, reaching its lowest point in 1891 (1.24 million). Due to continuous migration, the population flat-lined for the following sixty years until 1951, when it made a modest recovery to 1.37 million. Census 1991 recorded a population of 1.57 million, which grew to 1.68 million by 2001, just above the pre-famine figure. In 2014, the population stood at 1.84 million, and is projected to reach 1.94 million by 2024.
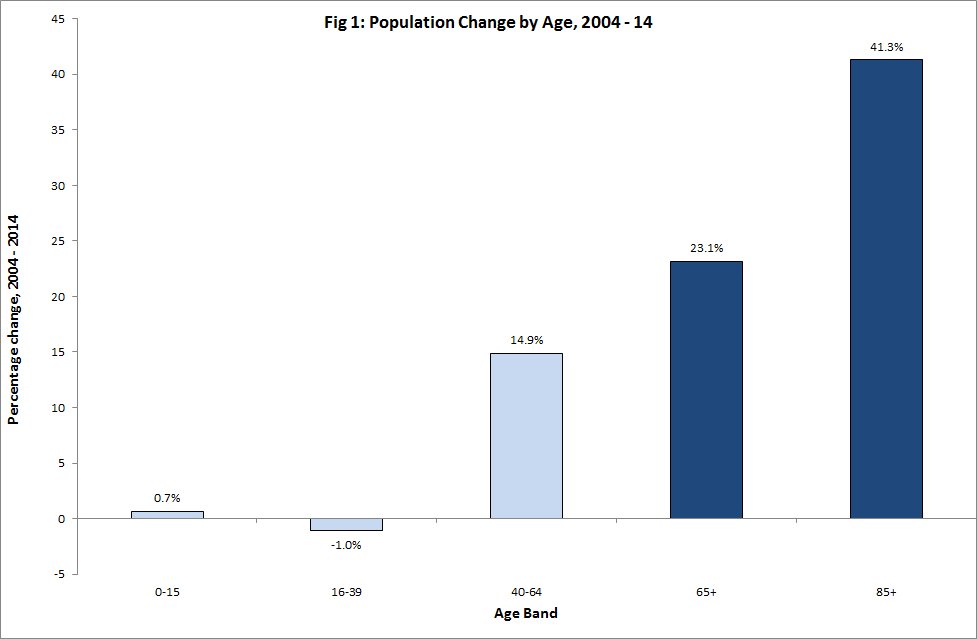
Population growth, however, has not been evenly spread, with the largest increases occurring in the older age bands. Between 2004 and 2014, the pension age population (aged 65+) rose by almost a quarter (23 per cent) to 286,000, while the number of those aged 85+ increased by 41 per cent to 34,000 (Figure 1). These trends are expected to continue in the coming decades: the latest projections (published in 2015) suggest that the 85+ population will reach 48,000 in 2024 and 67,000 by 2031. The average (median) age of the population, which was 38 years in 2014, is projected to reach 40.1 years in 2024, and 41.7 years by 2031.
 Northern Ireland Population Estimates 2014)")
In brief, the Northern Ireland population is growing older. The changing age structure has largely resulted from natural growth (the difference between the number of births and deaths). However, since 2004, net migration, particularly from the EU Accession countries, has also been a contributory factor.
Prior to 2004, population increase in Northern Ireland was mostly due to natural change (more births than deaths). However, in the year 2006 – 2007 the contribution from migration was greater than the contribution from natural change. From mid-2008 onwards, natural change reasserted itself as the dominant factor in population growth. Overall, during the full period 2004 – 2014, natural change accounted for 79 per cent of population growth in Northern Ireland, with net migration and other factors accounting for the remainder.
Comparisons with other UK countries, the Republic of Ireland and EU-28
Table 1 presents a number of key demographic comparisons between Northern Ireland and the other UK countries. The table reveals that Northern Ireland:
- Had the second fastest growing population in the UK (0.7 per cent annual increase) between 2004 – 2014;
- Has the youngest population in the UK (average age, 38.0 years in 2014);
- Has the highest fertility rate in the UK (1.97 births per woman in 2014). By 2024, the rate is projected to rise to 2.00, still higher than any other UK country; and
- Has the lowest death rate (8.0 per thousand population in 2014) of any UK jurisdiction.
Table 1: Population of Northern Ireland: comparisons with other UK Jurisdictions
| United Kingdom | England | Wales | Scotland | Northern Ireland | |
| POPULATION (millions, rounded) | |||||
| 2011 (Census) |
63.2 |
53.0 |
3.1 |
5.3 |
1.8 |
| 2014 (Estimate) |
64.6 |
54.3 |
3.1 |
5.3 |
1.8 |
| 2024 (projection) |
69.0 |
58.4 |
3.2 |
5.5 |
1.9 |
| Annual average % growth rate, 2004-14 |
0.7 |
0.8 |
0.4 |
0.5 |
0.7 |
| MEDIAN AGE (years) | |||||
| 2014 |
40.0 |
39.7 |
42.1 |
41.9 |
38.0 |
| 2024 |
40.9 |
40.6 |
42.8 |
42.9 |
40.1 |
| TOTAL FERTILITY RATES (children per woman) | |||||
| 2014 |
1.82 |
1.83 |
1.78 |
1.62 |
1.97 |
| 2024 (projected) |
1.87 |
1.89 |
1.88 |
1.63 |
2.00 |
| DEATHS (crude rate per thousand population) | |||||
| 1984 |
11.4 |
11.3 |
12.0 |
12.1 |
10.1 |
| 2014 |
8.8 |
8.6 |
10.2 |
10.1 |
8.0 |
|
Source: NISRA, ONS
|
|||||
The population of the Republic of Ireland went into a steep decline for over a century after the Great Famine, reaching a low point of 2.8 million in 1961 (Figure 2). However, since the early 1990s, both natural increase and significant net international migration have contributed to record population growth, with the result that the 2006 population of 4.24 million was the highest recorded since 1871. The latest estimate (April 2014) is 4.61 million, with the population projected to rise to 5.19 million by 2031.
")
Although the Republic of Ireland (median age, 36.0 years) currently has the youngest population in the EU-28, the number of older people is projected to rise substantially over the next decade. Depending upon the set of assumptions adopted, the older population (those aged 65 years+) may increase by between 17 and 38 per cent by 2026.
Changing fertility, life expectancy and migration will significantly alter the age structure of the EU population in the coming decades. The total population of the EU-28 was provisionally estimated to be 506.8 million in 2014, and is projected to peak at 526 million by 2050, declining thereafter. Again, trends in the EU-28 are broadly similar to those of the UK and Ireland, i.e. a progressively ageing population. While Europeans are living longer than ever before, they are having fewer children. This means the proportion of retired and elderly people will rise over the next few decades, while the proportion of working-age people will fall. The European migrant crisis, which emerged in 2015, may modify some of the above trends, but not significantly.
Implications of Ageing Population for Spending on Health and Pensions
As the baby boomer generations, born between the late 1940s and early 1960s, approach retirement across Europe, there will be important consequences for public expenditure. Two of the spending areas most likely to be affected are health and pensions.
The relationship between ageing and healthcare costs is not linear. Whilst it is true that older people consume more health services per head than any other group, health care expenditure increases rapidly only in the latter days of life. In particular, it is proximity-to-death that tends to increase costs, rather than age per se. According to the latest projections, the number of deaths is expected to maintain its current level (15,000 per year) until 2023, rising slowly thereafter. In brief, health care costs in Northern Ireland associated with approaching death are likely to rise modestly in the coming decade. However, in the following decades, such costs may rise more steeply in line with the growing number of deaths.
The impact on pension provision of the sharp increase in the projected number of older people in Northern Ireland is likely to be modified by a number of factors. For example, the abolition of the Default Retirement Age (DRA), the gradual rise in state pension age, and the growing tendency for older people to work beyond retirement age, will all serve to reduce the projected number of pensioners and their associated costs.