Please note: this article was edited on 11.2.20 with up-to-date GIS maps showing travel distances to GP practices for 2015 and 2020.
Geographical Information Systems (GIS) Day was established in 1999. Its main aim is to promote the benefits of GIS to those outside the field. Therefore, this year’s GIS day is a good opportunity to showcase how the Northern Ireland Assembly uses GIS on a daily basis.
GIS is all about maps. Whether it’s a map showing a place or a map depicting a statistic, maps have the power to offer insights into a wide range of issues. So how has the Assembly Research and Information Service (RaISe) utilised this tool? Turning data into a compelling map is essentially about telling stories clearly and simply. This is what makes maps a useful tool in answering research queries. Here are a few examples of maps created over the past year:
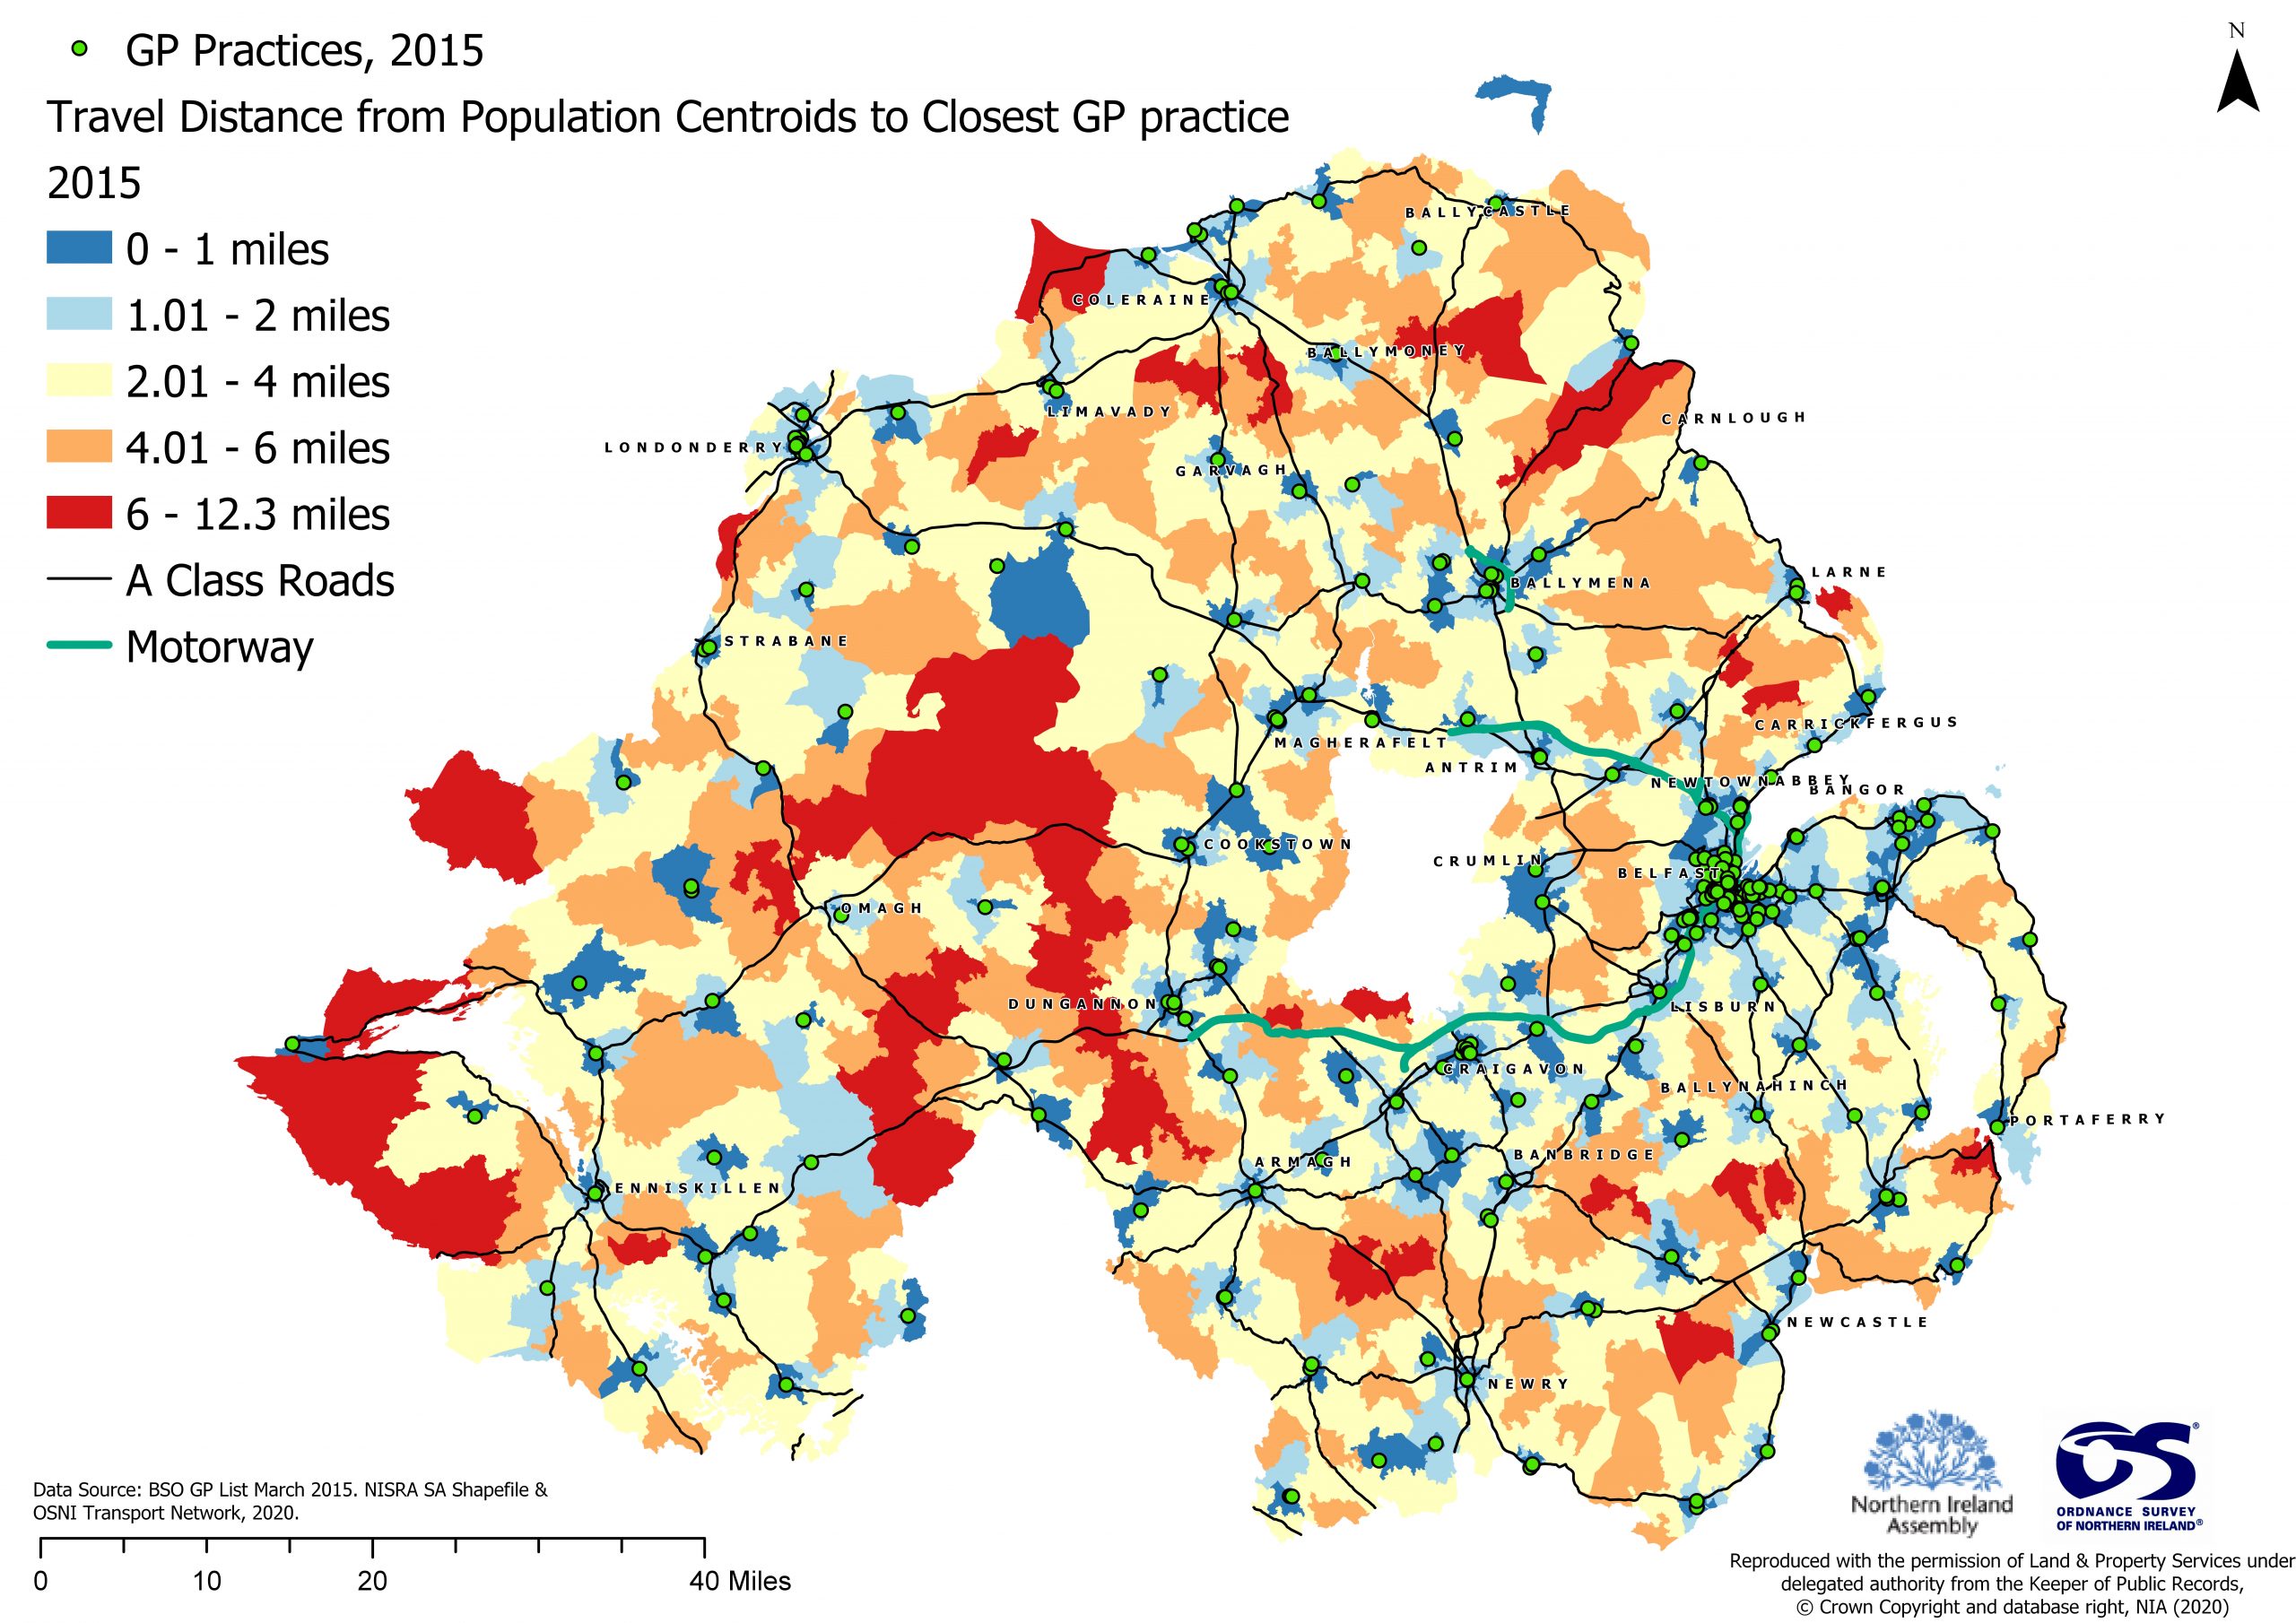
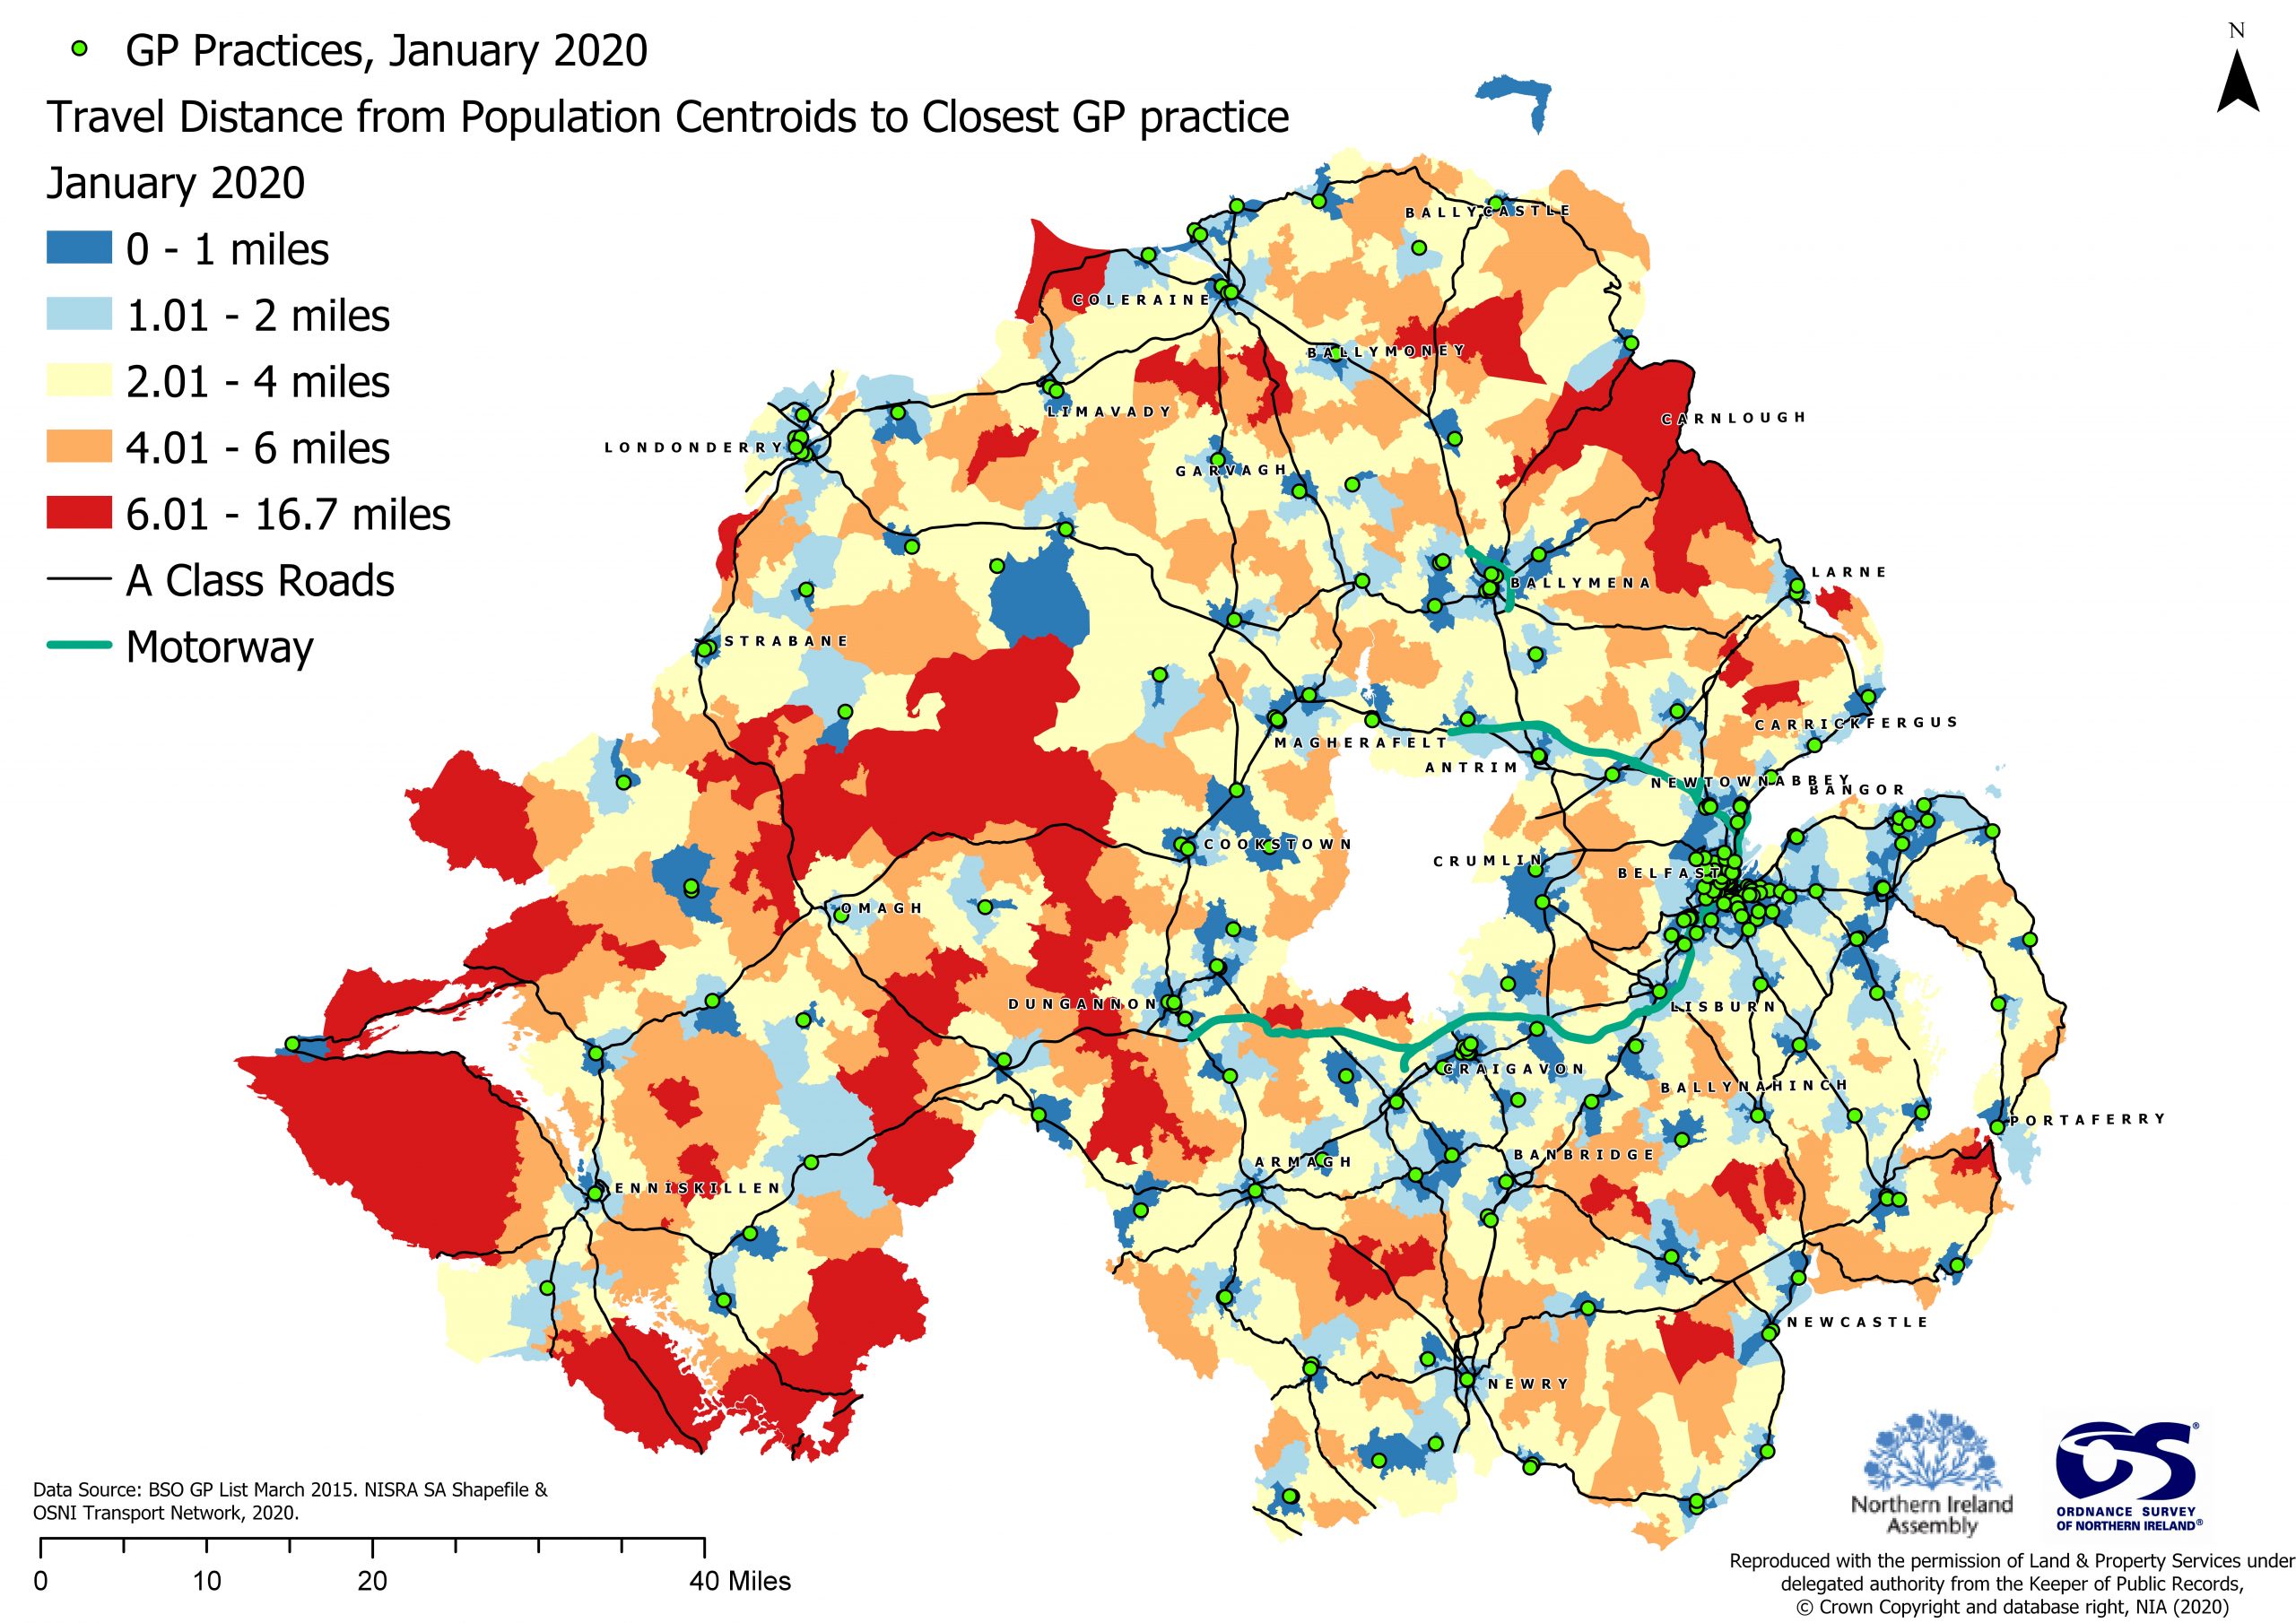
GP Travel Distance analysis
How far do communities have to travel to their nearest GP surgery? The maps below show the locations of all GPs in 2015. Following this, the other map displays all the GPs in March 2018, along with travel distances from small areas to their nearest service. The maps indicate increases in travel distances in some rural areas.
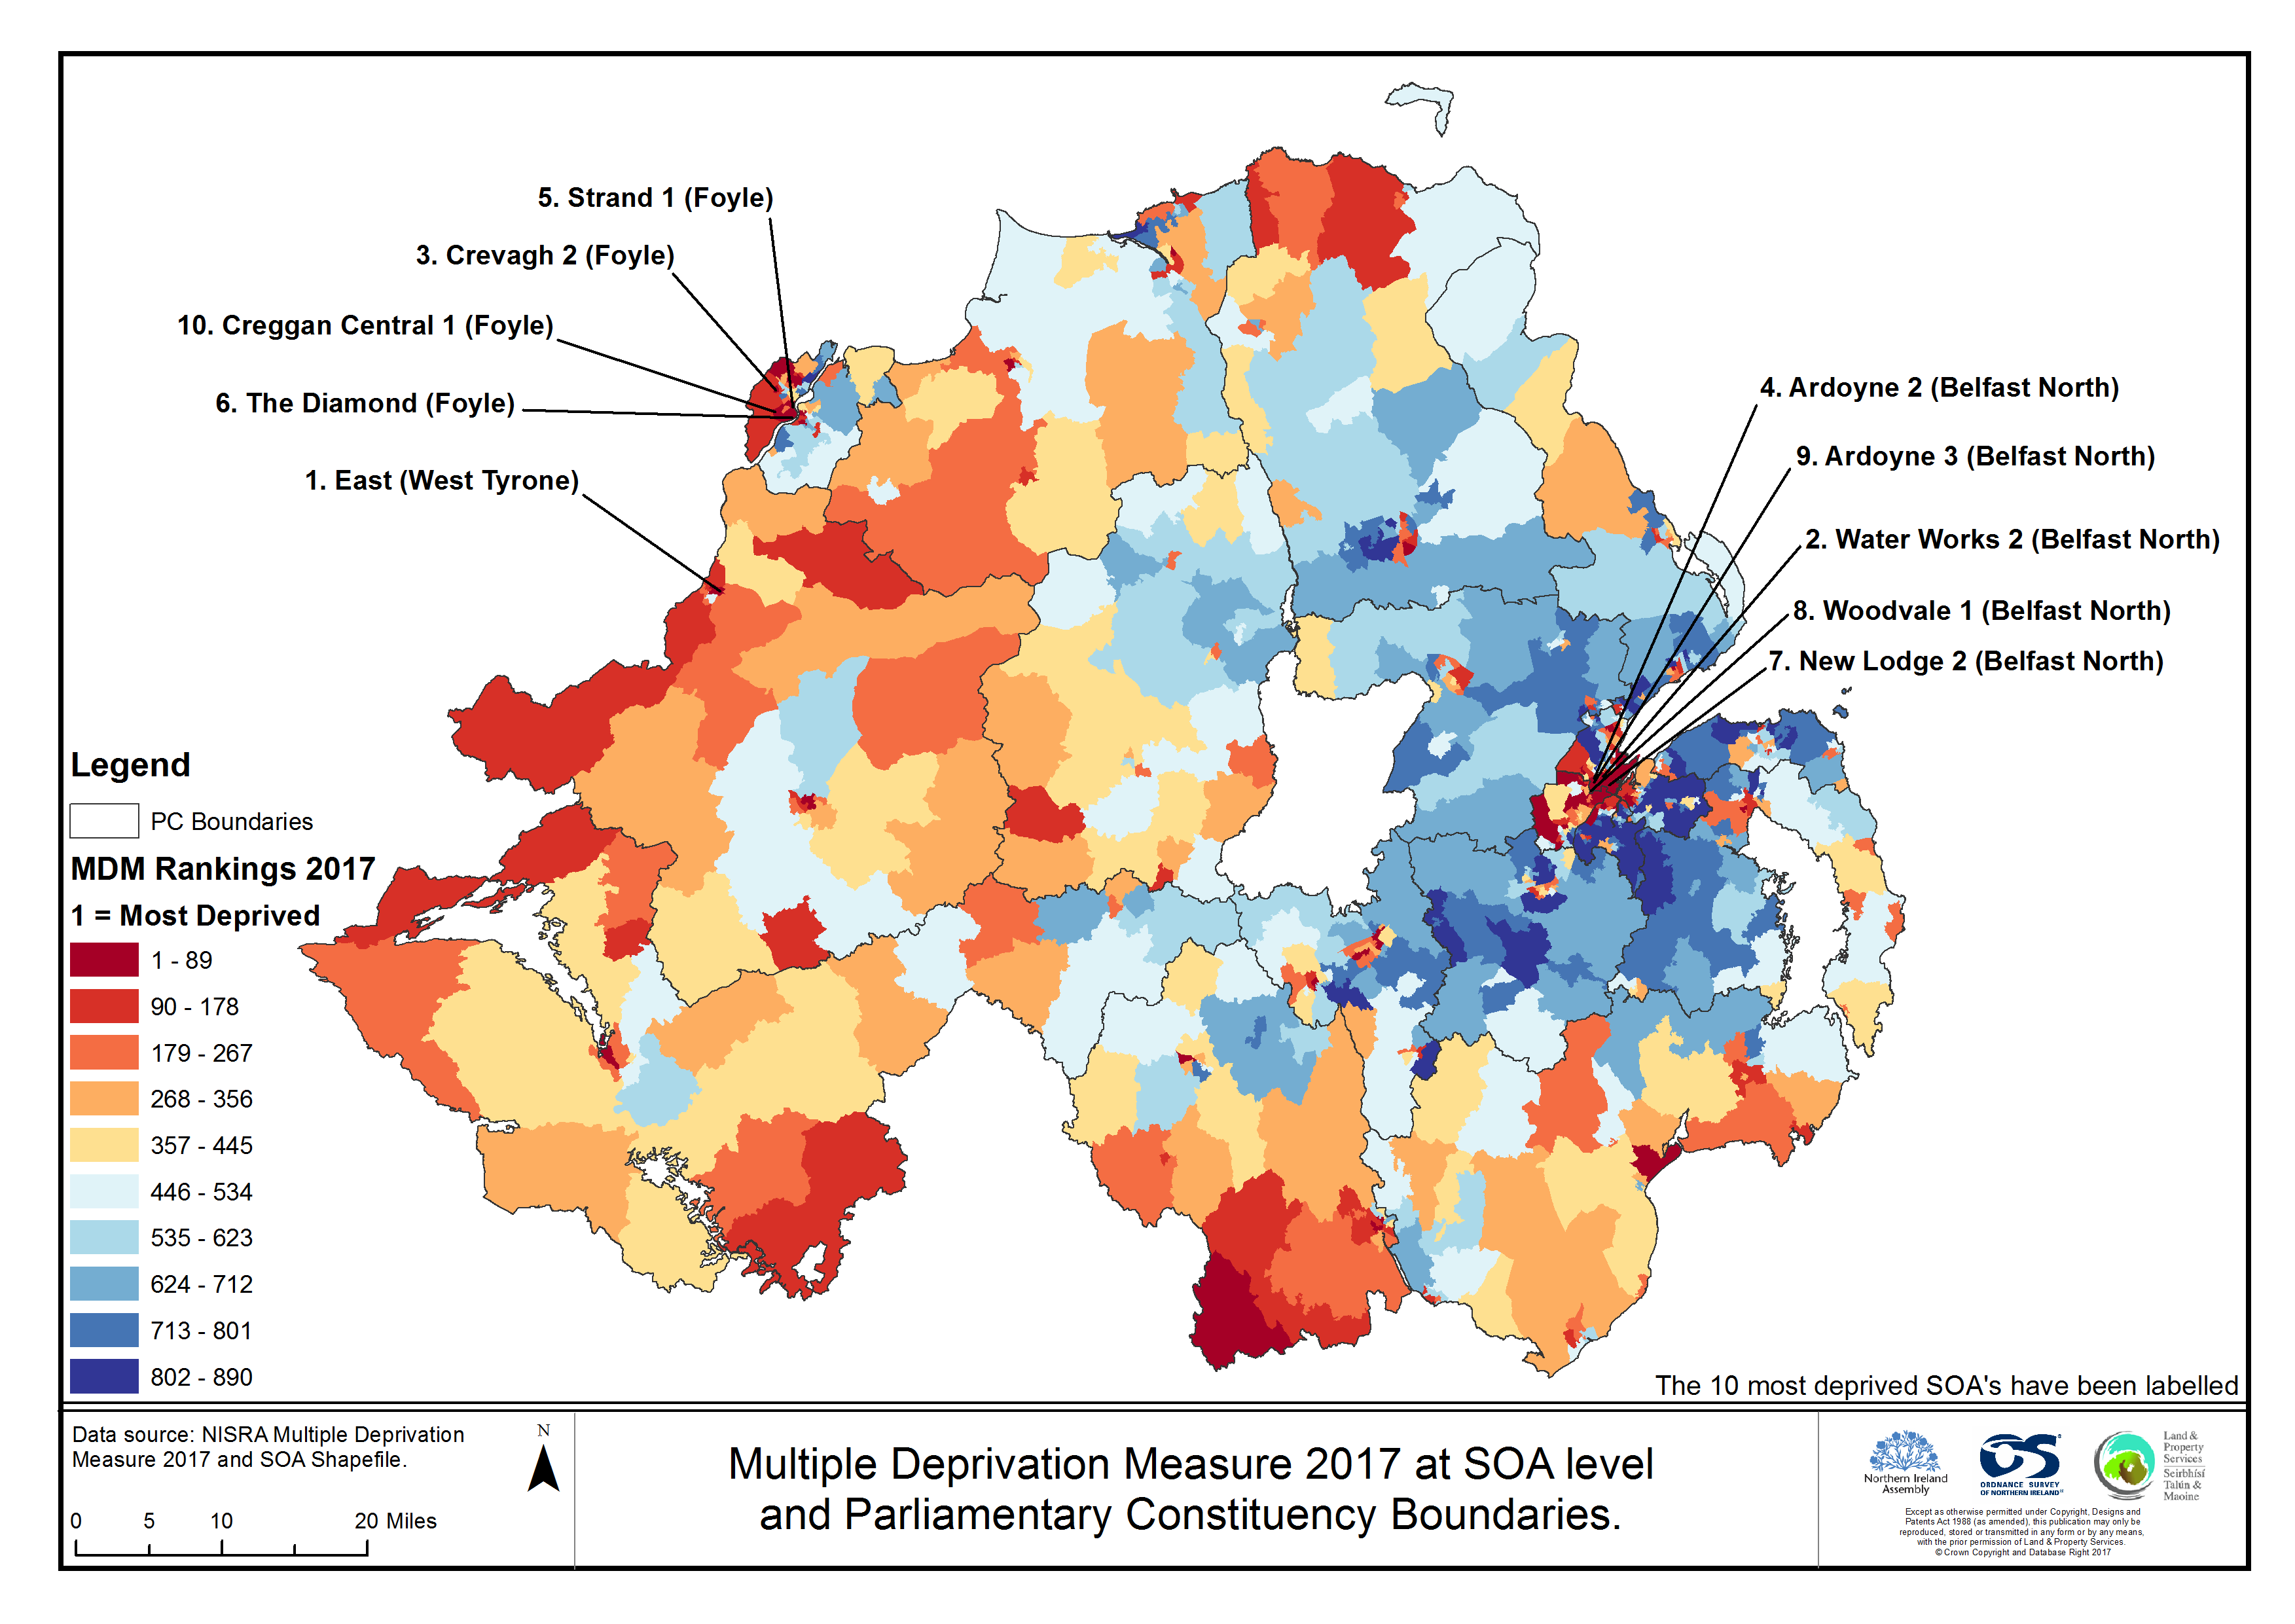
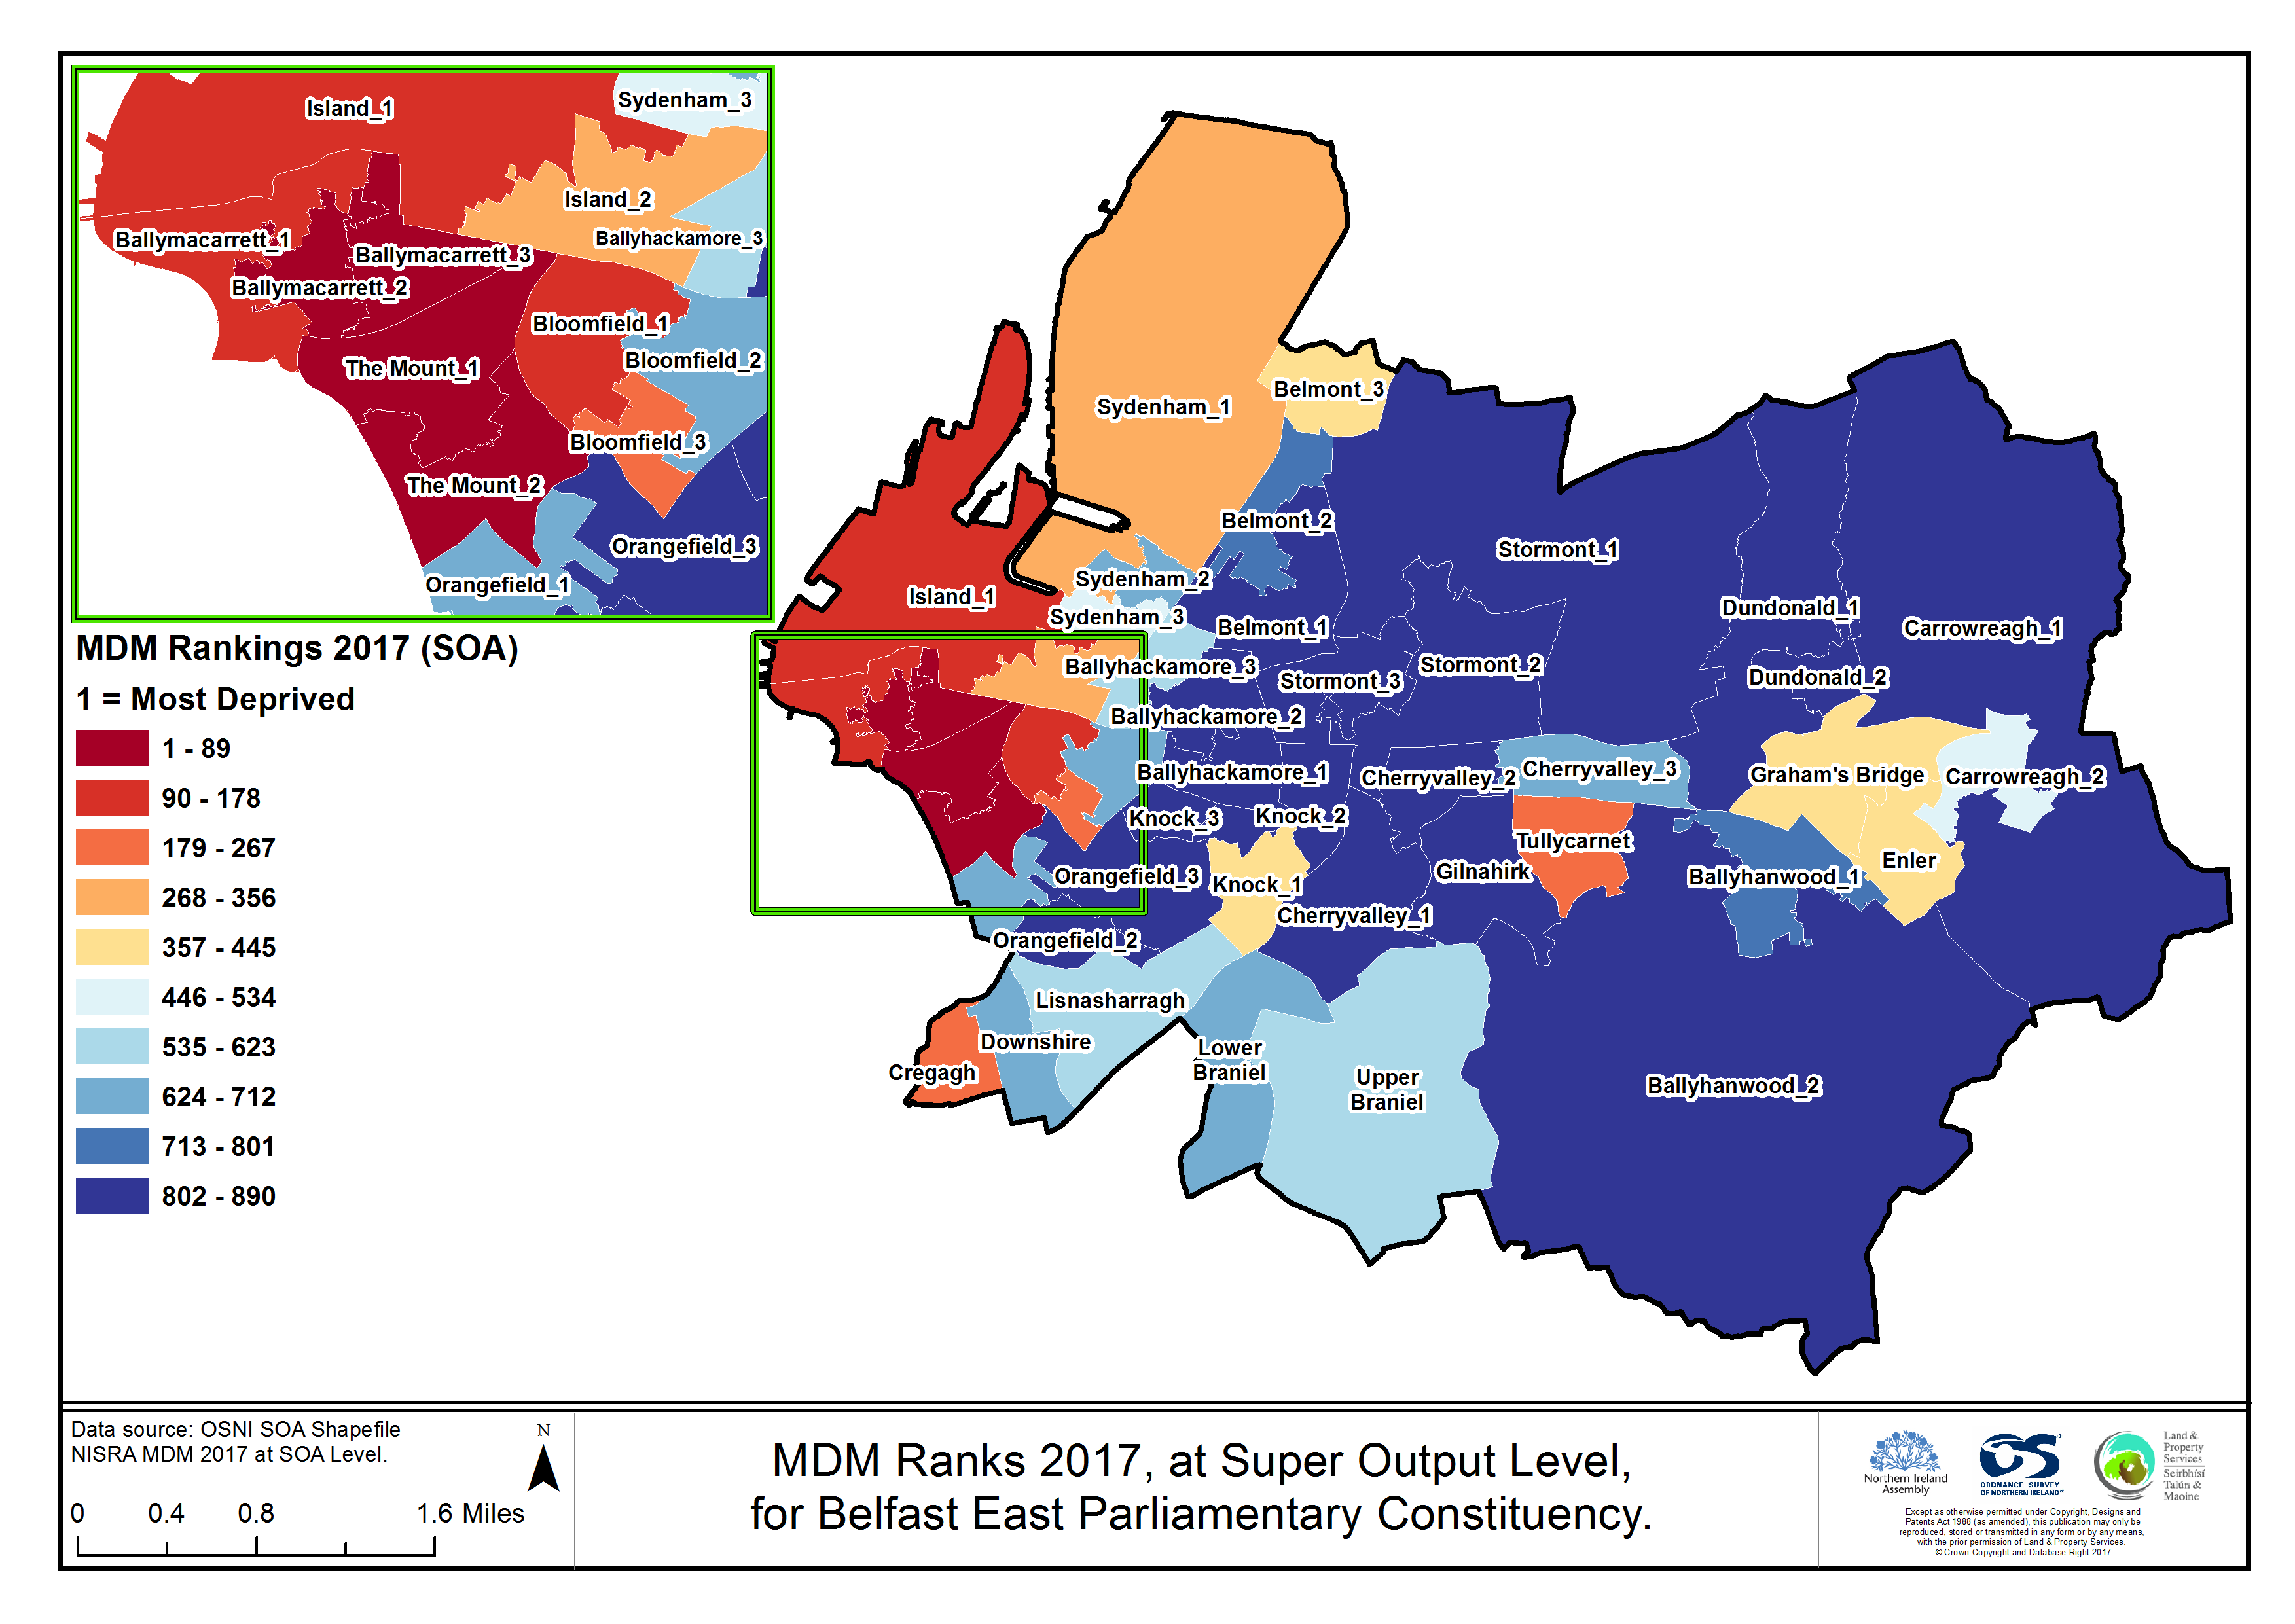
Newest Multiple Deprivation Measure
In November 2017, NISRA published their updated Multiple Deprivation Measure, replacing their 2010 version. One of the best ways to visualise these measures is through mapping the areas by their rankings, as seen below. For further details, please refer to the Multiple Deprivation paper published by RaISe earlier this year: Multiple Deprivation in Northern Ireland.
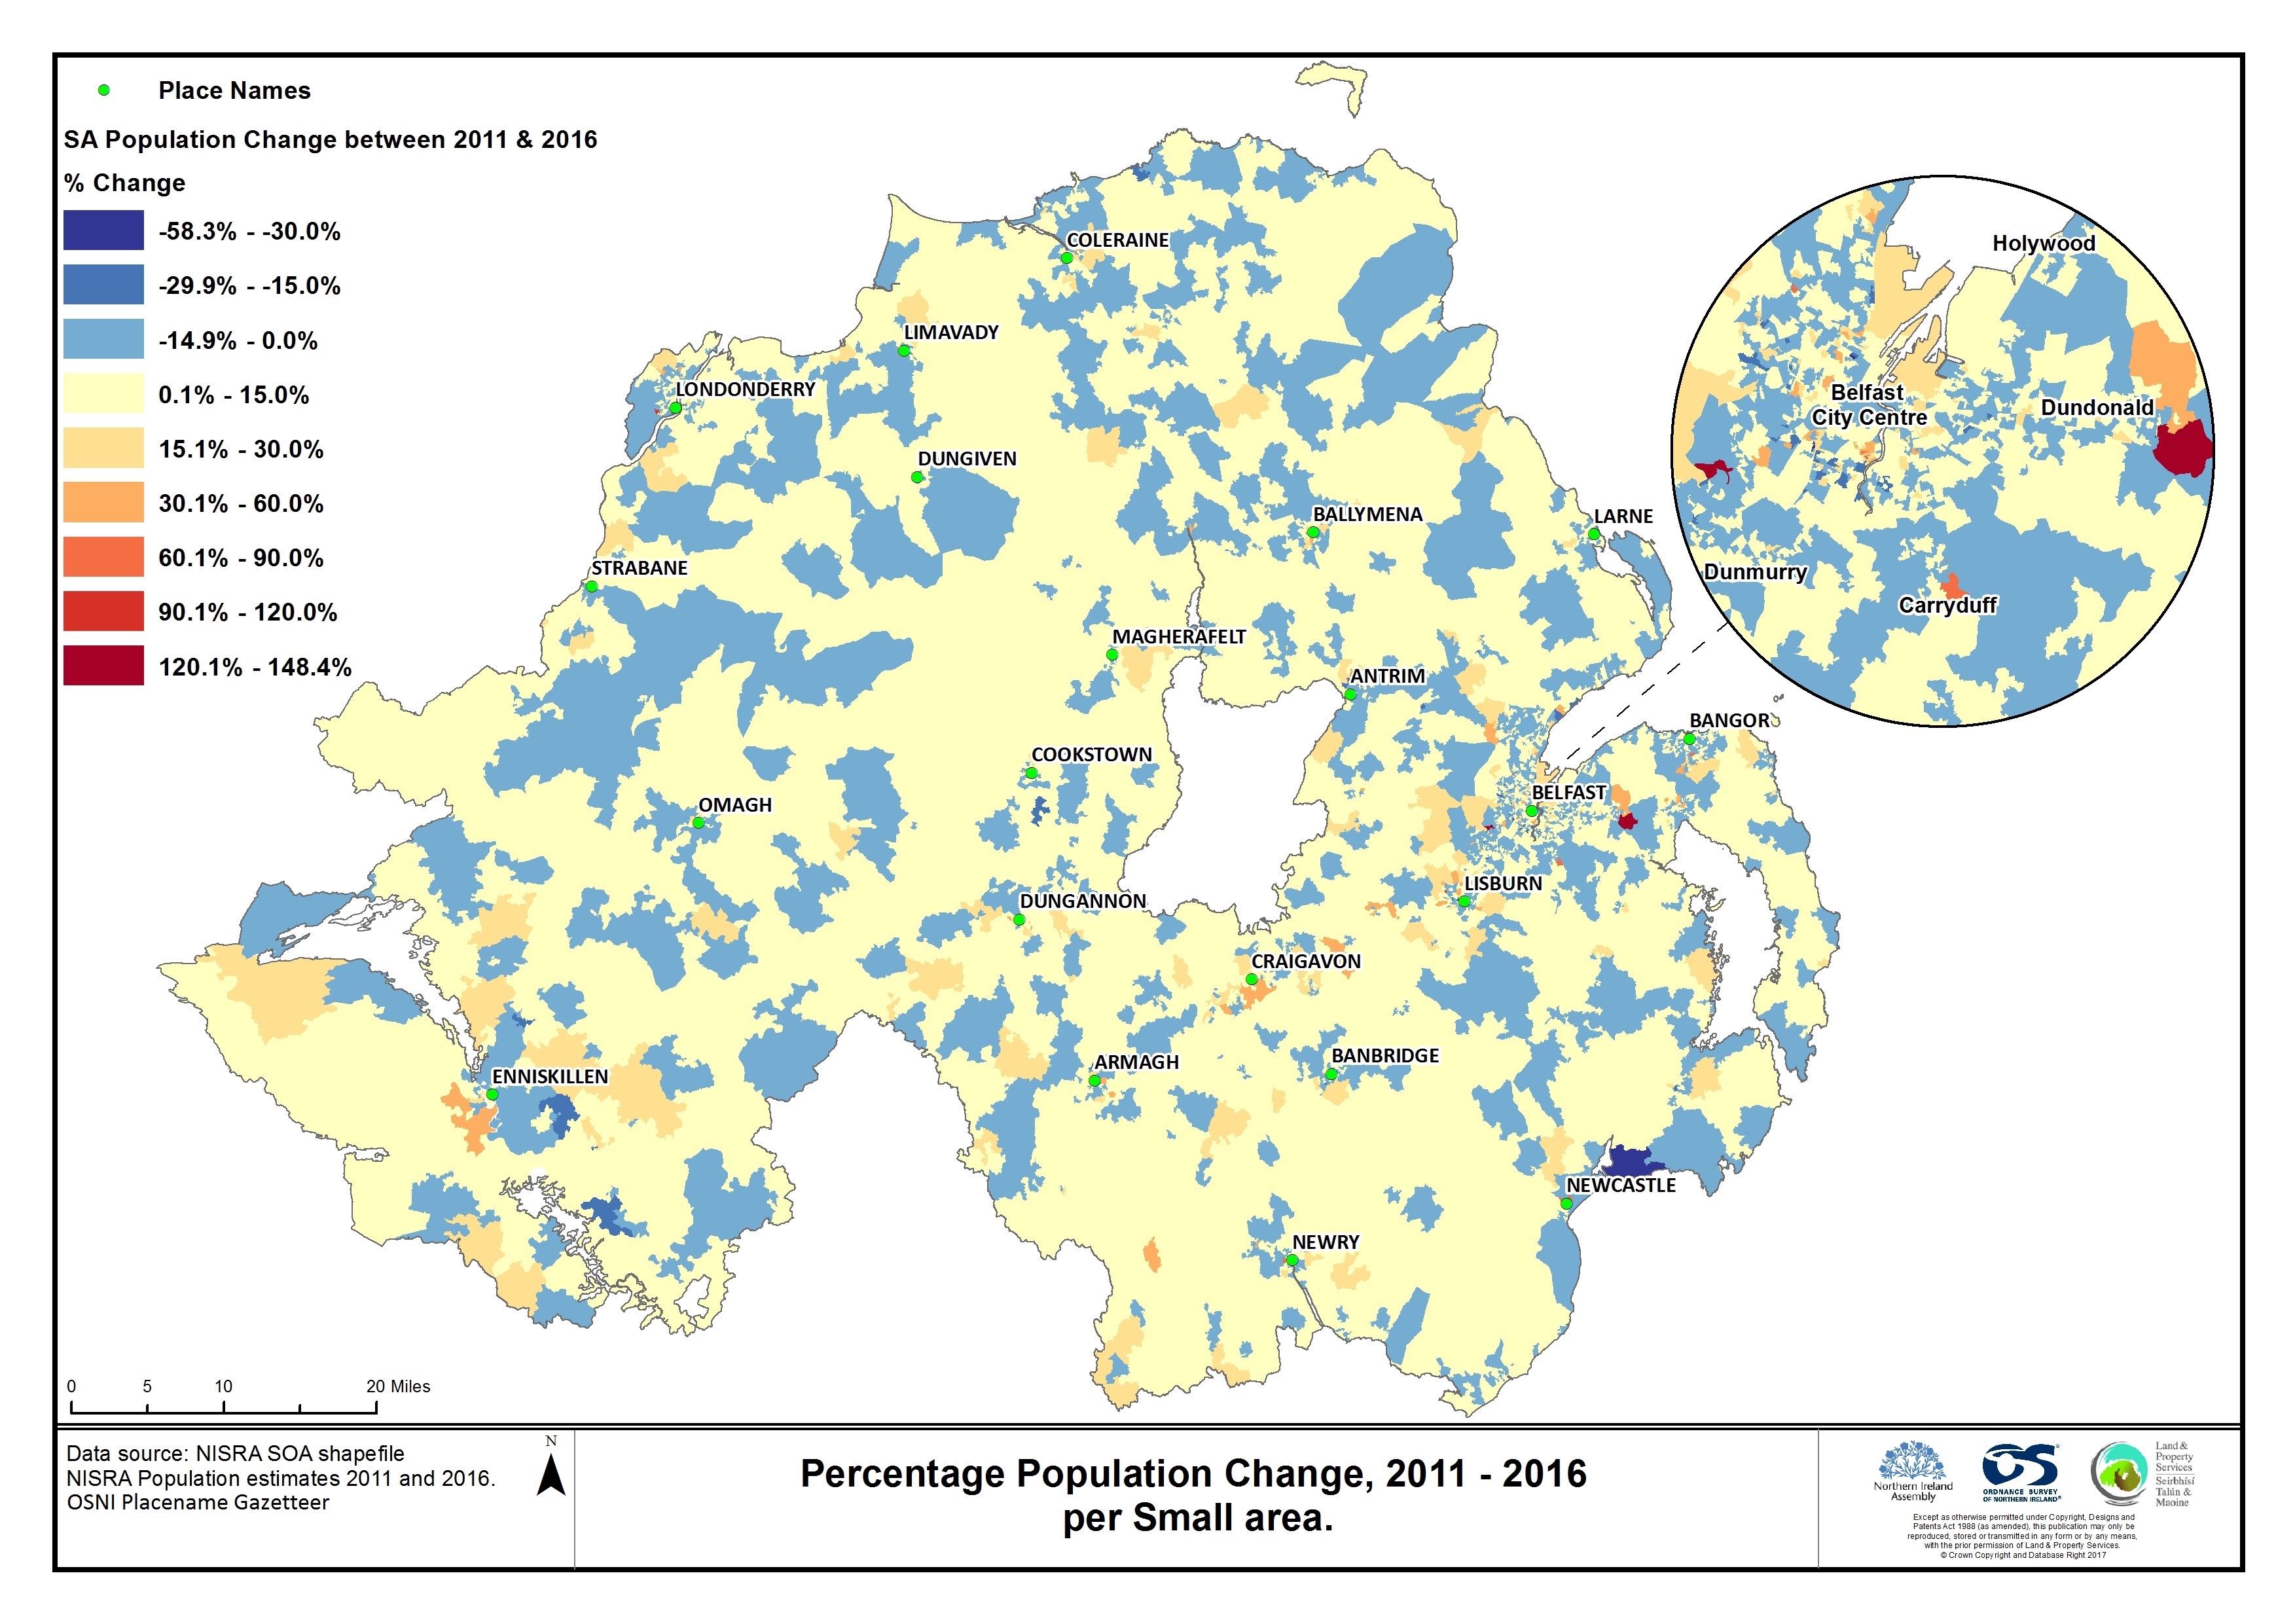
Demographic change
A popular use of mapping is to view common statistics across a geographic area to find hidden patterns which aren’t apparent in a column of raw data. As you can see below, statistics have been given geographic context, using a map to depict where the biggest population changes have occurred in Northern Ireland.
Any dataset which includes a location, whether it’s an address, a postcode, a ward name or constituency, can then have GIS applied to harness that information and create meaningful maps based on the geographic context of the data.
For examples of the work we have completed in previous years, please refer to our other GIS blog articles;
- The Geographic Information Service at the Northern Ireland Assembly
- Geographic Information Services in the Northern Ireland Assembly: What do we provide for Members?
RaISe offers GIS analysis to MLAs and our Research Officers. We have access to the latest Ordnance Survey Northern Ireland® (OSNI) branded digital map data, available under the Northern Ireland Mapping Agreement (NIMA). MLAs can contact our GIS Consultant Keara McKay: [email protected]
The following Geographical Information Consultancy Services are available to Members:
- Custom made mapping outputs
- Training in geographic information systems;
- OSNI historic mapping;
- Mapping statistics by administrative geographies e.g. constituency and ward level;
- Comparing change over time, e.g. demographics;
- Mapping boundary changes, e.g. the new constituency areas.
- Mapping accessibility to services in both rural and urban areas.