The finances of Northern Ireland’s schools have been in the spotlight for some time. For example, the Northern Ireland Affairs Committee at Westminster is currently holding an Inquiry into Education funding. In June 2018, Northern Ireland’s post-primary school principals wrote to the Education Authority (EA) warning of ‘crisis’. In December 2017, the Department of Finance published Briefing on Northern Ireland Budgetary Outlook 2018-20, which painted a stark picture of budgetary pressures, increasing pay costs, and higher levels of Special Educational Needs (SEN).
This blog article aims to shed further light on this matter, providing nine key charts compiled by the Assembly Research and Information Service (RaISe) using historical financial data, including those recorded by the UK Treasury and the Northern Ireland Department of Education (DE).
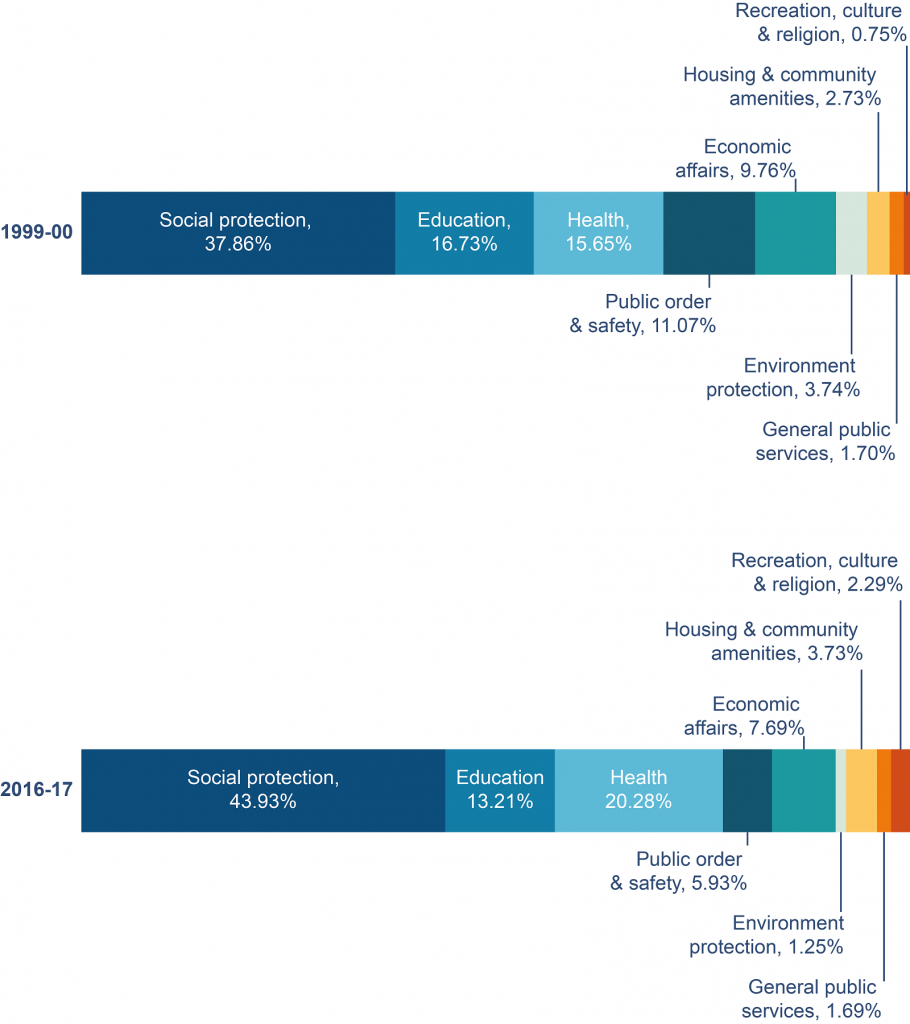
Chart 1 uses the UK Treasury’s data on historic spending, which are classified using the international Classification of Functions of Government (COFOG) system. It shows that:
- In 1999-2000, spending on Education made up 16.73% of Northern Ireland’s Total Expenditure on Services (TES).
- By 2016-2017 (the last year in which there was a budget agreed by the Northern Ireland Executive), this had fallen to 13.21%.
A range of factors that have contributed to the relative decline in education spending are examined here. One significant factor has been the relative increases in spending in other areas – notably Health and Social Protection – which have been driven partially by population ageing and increasing fertility. (See our previous blog post on A Demographic Profile of Northern Ireland in 2016 for more information.)
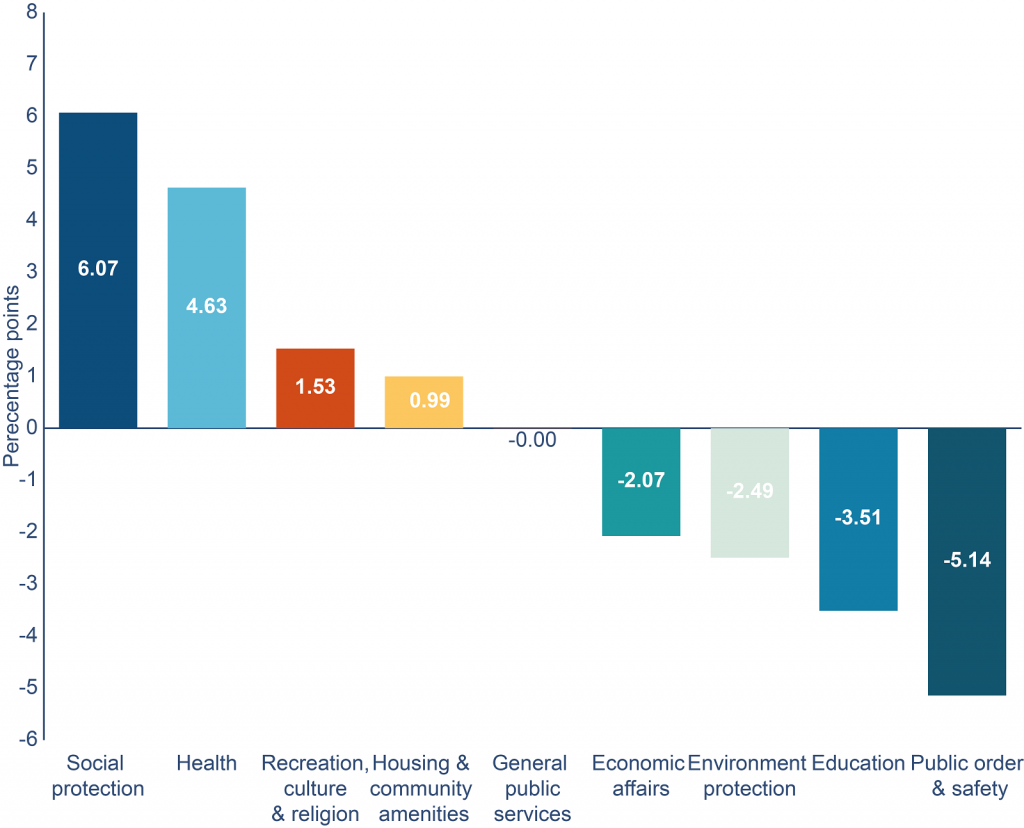
Chart 2 uses the same source data as Chart 1, but focuses more closely on the change between 1999-2000 and 2016-2017. It shows the change in percentage points in each COFOG sub-category of TES between those dates. In addition to the relative fall in expenditure on education over the given period, other points to note include:
- The largest expenditure reduction was in Public Order and Safety: the ‘peace dividend’.
- The large relative increases in health expenditure is unsurprising, given rising costs across the world’s advanced economies in the health sector.
- Under the current financial arrangements underpinning devolution, much social protection expenditure is governed by the Parity Principle. In essence, this means Northern Ireland has limited scope to depart from policy decisions in Great Britain, which consequently drives overall expenditure levels.
- A lot of the social protection expenditure is what is called Annually Managed Expenditure (AME), and is not directly controlled by the Northern Ireland Executive or Assembly. For example, under prevailing arrangements, the level of out-of-work benefits is set at Westminster, and the funding needed to make payments to individuals is transferred directly from the Treasury.
Under the current devolution arrangements, the largest element of TES is called Non-ring-fenced Resource Departmental Expenditure Limits (DEL). This funding can be used to pay for day-to-day running costs, such as teachers’ pay, school maintenance and stationery.
The Northern Ireland Executive and Assembly, when in operation, decides how to allocate the Non-ring-fenced Resource DEL. This is unlike the separate process for AME funding mentioned above. The choices made about prioritisation within the DEL category reveal more about local budgetary preferences for devolved services than changes in AME.
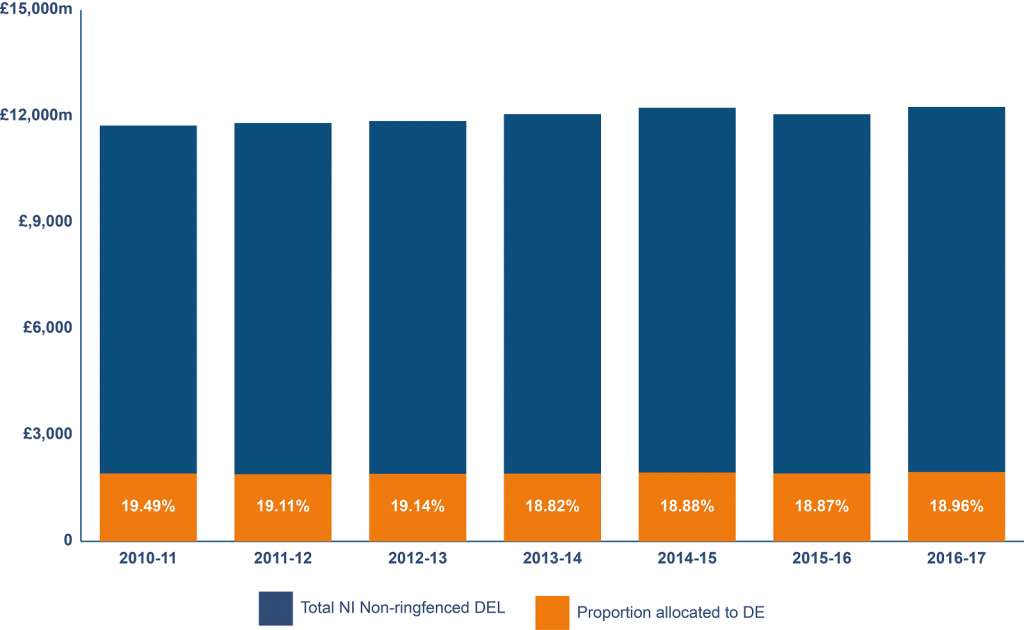
Using data from Northern Ireland Executive budget documents, Chart 3 shows that during the period 2010-2017:
- Northern Ireland’s total Non-ring-fenced Resource DEL increased slightly over the stated period in cash terms (i.e. not adjusted for the impact of inflation).
- The proportion of that total allocated to DE fell by just over half a percentage point (i.e. it did not grow at the same rate as the total).
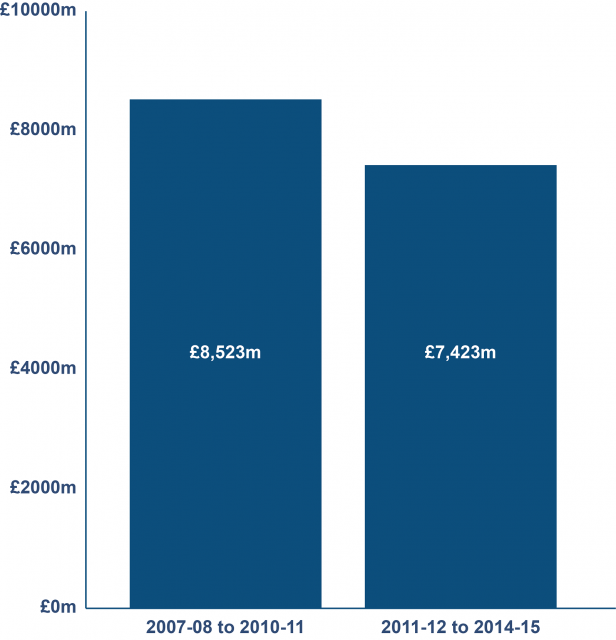
Chart 4 above relies on Northern Ireland Executive budget documents, which do not take account of any in-year changes in DE’s allocation through the Executive’s in-year Monitoring Rounds. It also draws on a 2010 publication produced by RaISe; wherein the total allocation to DE (i.e. both Resource and Capital DEL) from 2007-2008 to 2010-2011 was calculated. The 2010 RaISe publication then compared that figure with the total planned allocation from 2011-2012 to 2014-2015, based on 2010-2011 prices.
In doing so, Chart 4 compares the ‘spending power’ of DE’s cash allocations over time, converting nominal figures into ‘real terms’ (i.e. adjusting for inflation).
Chart 4 shows that:
- The buying power of DE’s 2007-2008 to 2010-2011 was just over £8.5 billion.
- The buying power of DE’s 2011-2012 to 2014-2015 was just over £7.4 billion.
In other words, the total allocated to education in Northern Ireland for 2011-2015 was £1.1 billion (i.e. £1,100 million) lower than the total allocated for 2007-2011. While these figures do not tell us much about schools’ expenditure needs across the given periods, they do help to contextualise the total DE allocation for the current financial year.
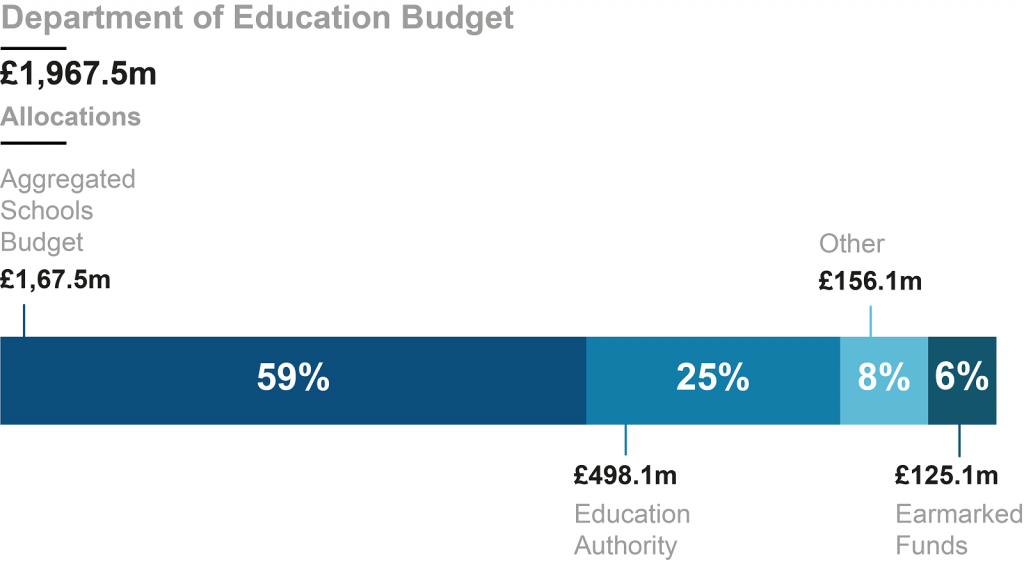
Using data provided by DE, Chart 5 shows that:
- Almost two-thirds of DE’s allocation went directly to schools through what is called the Aggregated Schools Budget. Through the policy of Local Management of Schools, controlled schools submit financial plans to the EA on a rolling three-year cycle. These plans highlight how the vast majority of school spending goes on salaries for teaching and non-teaching staff.
- A quarter of DE’s budget went on the EA block grant (the main source of the funding available to the EA), which is broken down below in Chart 6.
It is immediately apparent that the funding directly delegated to schools, or delivered to them via the services provided by the EA, makes up almost 85% of the total DE allocation.
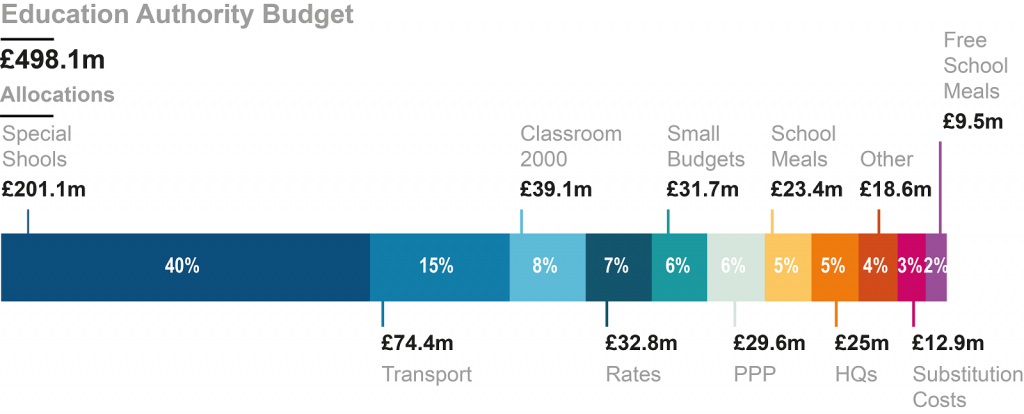
Using data provided by the DE, Chart 6 shows that:
- 40% of the EA’s block grant funded Special Schools.
- 8% and 6% was paid to Classroom 2000 (an IT contract) and Public Private Partnership (PPP) Contracts.
- 7% was to pay rates, a statutory obligation.
Taken together, Charts 5 and 6 begin to show how difficult it is to identify where either the DE or the EA could save significant sums of money that could be passed on to schools.
Certain areas of expenditure are difficult to reduce because of public opinion. For example, it would be hugely unpopular to cut provision for special schools. In addition, to remove free school meals would appear to be contrary to Executive policies targeting social deprivation and relieving poverty.
Other expenditure, such as Classroom 2000, rates, and Public Private Partnership payments, relate to contracts or legal requirements, and are therefore likely to be inescapable without financial penalty.
So, given the challenging high-level financial context outlined above, how well are schools themselves coping?
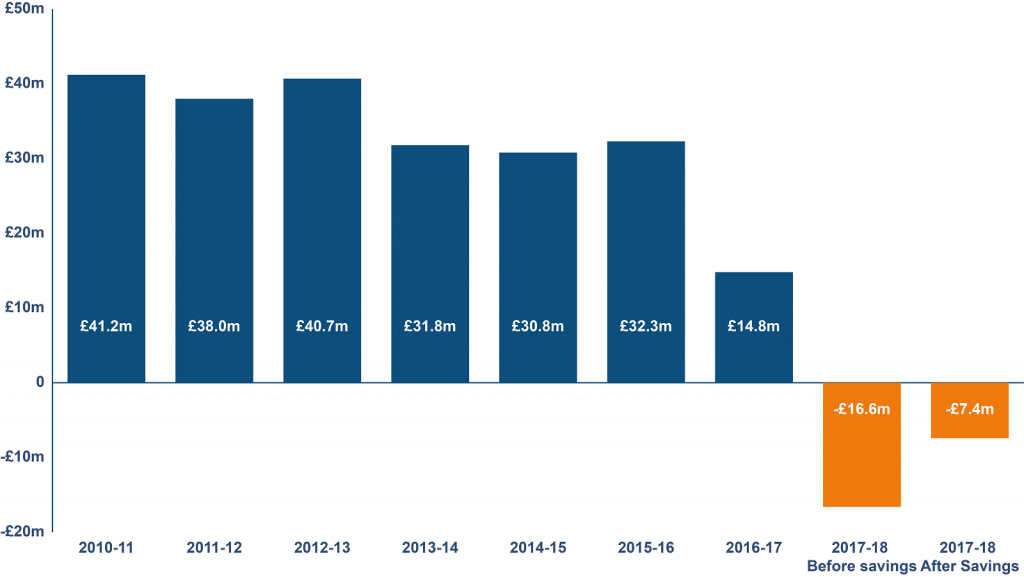
Chart 7, based on data provided by the EA, shows the combined total of all individual Controlled and Maintained schools’ surpluses/deficits. Controlled schools are required to provide three-year financial plans to the EA. In summer 2018, schools therefore provided plans for school years 2018-2019, 2019-2020 and 2020-2021. Data was not provided by the EA for these future years. But, given the trend suggested by this Chart, it is quite possible that deficits may increase further.
Note there are both ‘before savings’ and ‘after savings’ totals for 2017-2018. According to the EA, “2017-18 figures before and after savings which have not been finalised and are subject to change.” In any case, the story in Chart 7 is clear: surpluses have reduced since 2010, until the most recent academic year, when the overall position actually tipped into deficit.
But how does this summary picture look at school level basis?
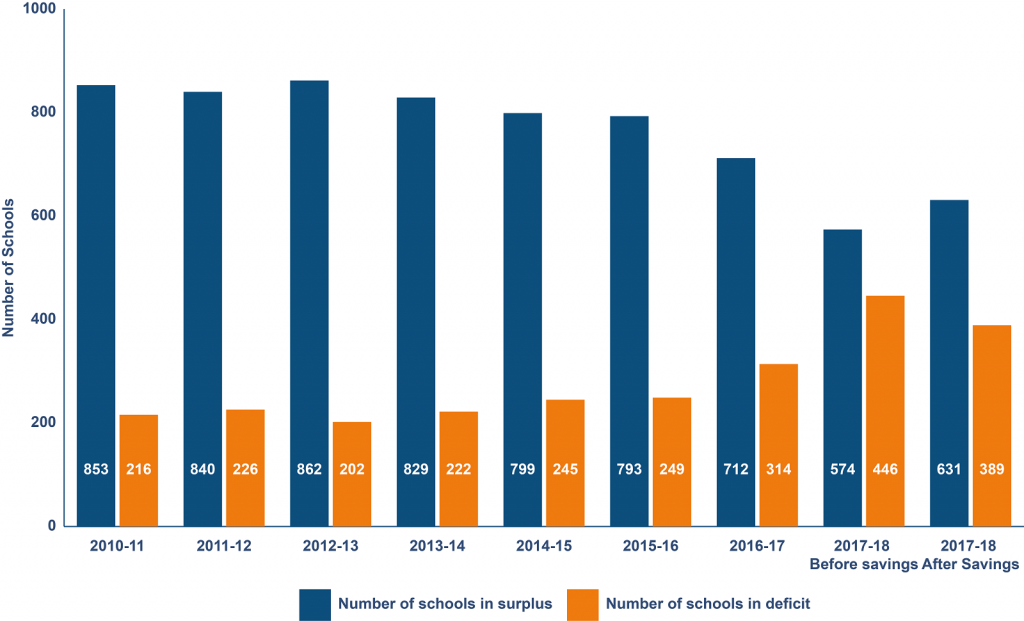
Also based on EA data, Chart 8 shows:
- The peak year for schools with a budget surplus was 2012-2013. Since then, the number of schools with a surplus has declined.
- At the same time, the number of schools with a budget deficit has increased to either 446 (44%) or 389 (38%), subject to finalisation of savings figures.
So, until these figures are finalised and audited in line with DE’s Guidance On Financial And Management Arrangements it seems somewhere between a third and a half of Northern Ireland’s Controlled and Maintained schools will have recorded a budget deficit in the most recent school year. These findings echo a recent NI Audit Office Report The Financial Health of Schools which found the following (on page 3):
This report indicates an environment where there is pressure on school budgets, increasing pupil numbers and schools with sustainability issues. Therefore, it is clear the system is coming close to a tipping point and action needs to be taken as a matter of urgency.
Is the worsening position because there is currently no Executive Budget in place for Northern Ireland?
In the absence of devolved government, the Secretary of State (SoS) for Northern Ireland has brought budgets for 2017-2018 and 2018-2019 in the UK Parliament in Westminster. This has been essential to enabling the continuance of services like education and schools. Chart 9, below, shows the same data as Chart 3, but with figures from the most recent financial years also included.
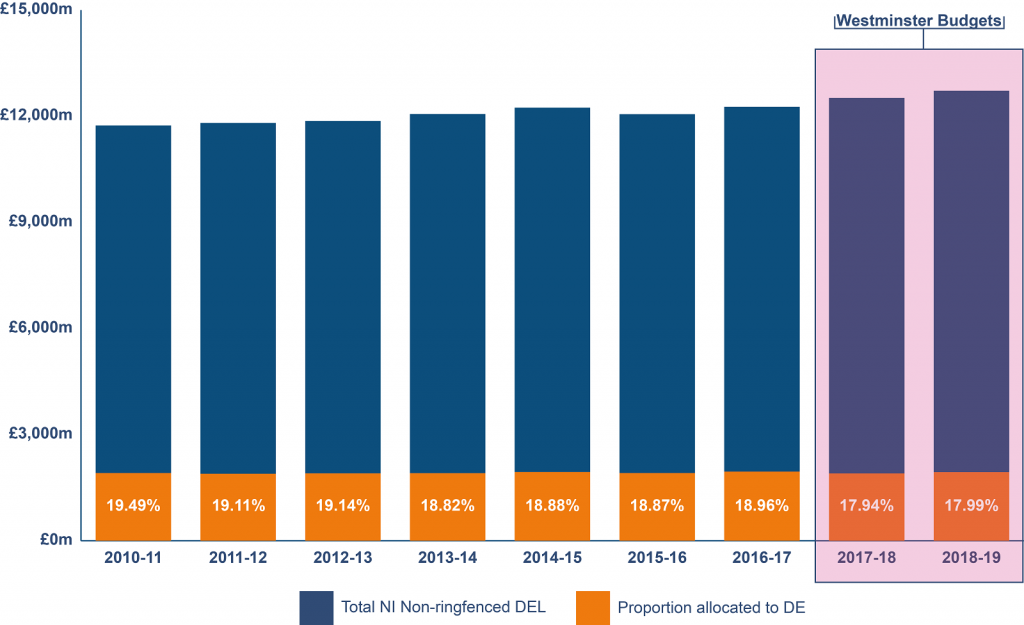
Chart 9 above uses budget data, showing:
- For 2017-2018, DE was allocated £1,904.1 million Non-ring-fenced Resource DEL (17.94% of the Total).
- For 2018-2019, DE was allocated £1,939.4 million Non-ring-fenced Resource DEL (17.99% of the Total).
With the new financial year swiftly approaching in April 2019, it is reasonable to assume that planning for 2019-2020 budget planning for Northern Ireland is already underway. The UK Chancellor’s October 2018 Budget confirmed that funding for Shared Education that was previously agreed in the Fresh Start Agreement remains available for projects to go ahead.
Given on-going political circumstances, and the continued absence of a functioning Executive, it is assumed that the SoS, supported by Northern Ireland departmental officials, will soon bring forward budget proposals for Northern Ireland departments. Assuming current governing arrangements continue, departmental allocations should reflect the outworking of the Outcomes Delivery Plan 2018-2019, amongst other relevant things. For example, in relation to education, the departmental allocation will presumably reflect that Plan’s commitment to address the following:
…the link between underachievement and socio-economic background is stronger here than in many other OECD countries and the gap in attainment between the most and least advantaged in society exists from the earliest point.
But it remains to be seen how the SoS and Northern Ireland departmental officials bring forward a budget for Northern Ireland. In the immediate term, DE got an additional £35.9 million as part of 2018-2019 in-year monitoring. But in the longer term, how will competing demands be met when DE is allocated its budget?