By Michael Scholes & Aidan Stennett
To highlight International Women’s Day, the following article updates our previous blog article examining the Gender Pay Gap in Northern Ireland, presenting the latest available data.The UK Government defines the ‘gender pay gap’ (GPG) as:
… the difference between the average earnings of men and women, expressed relative to men’s earnings. For example, ‘women earn 15% less than men per hour’.
The GPG should not be confused with equal pay, which refers to paying men and women differently for doing the same work. This discriminatory practice was made unlawful in the UK by the Equal Pay Act 1970.
The UK Government has identified a number of factors contributing to a gender pay gap, including:
- A higher proportion of women choose occupations that offer less financial reward (e.g. Administration), whilst many high paying sectors are disproportionately made up of male workers (e.g. Information and Communications Technology.
- A much higher proportion of women work part-time (PT), and PT workers earn less than their full-time (FT) counterparts on average.
- Women are less likely to progress up the career ladder into high paying senior roles.
The reasons for these factors are complex and overlapping, which this blog does not address in detail, other than to note research undertaken by the Institute for Fiscal Studies (IFS) in 2016, which highlighted that:
- The pay gap widens when people are in their late 20s, with male wages increasing and female wages flat-lining. This is, the IFS believes, a result of women having children around this age. Following this, the gap continues to widen as women lose out on labour market experience, impacting their future wage potential;
- Women also tend to enter part-time employment following the birth of their first child, reflected in the high number of women working part-time. This part-time working also appears to be persistent. Even after a child has reached the age of 20, women are more likely to remain in part-time employment, potentially reflecting the impact of a loss of labour market experience; and,
- Choice of occupation, as noted above by the UK Government, also plays an important role in the development of a gender pay gap. In broad terms, women tend to work in lower paying sectors.
It is also worth noting that that if we are to understand the GPG, there is a need to examine the causes, using a range of techniques, to go beyond simple measures such average hourly earnings. This allows more considered examination of the issue, and better understanding, ultimately serving to decrease the GPG. The rest of this blog explains measures that are widely used at this time in the UK, and how the extent of the GPG can depend on the measures used.
Measuring the GPG
There are various ways to measure the average earnings of men and women. A very different picture of the gender pay gap is presented, depending on which method of measurement is chosen. In the UK, the Office for National Statistics (ONS) and the Northern Ireland Statistics and Research Agency (NISRA) prefer to use FT median hourly pay – excluding overtime – as their headline measure of gender pay differentials. In their view, overtime can often distort the picture as more men than women tend to work overtime. The median is preferred because using the mean (another measure of averages) can misrepresent the data, due to small numbers of very high earners. NISRA also asserts that using hourly earnings:
…better accounts for the fact that men work on average more hours per week than women.
GPG in Northern Ireland
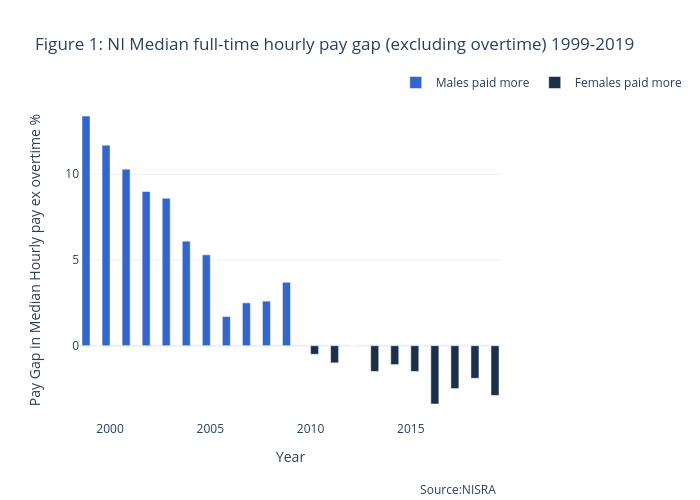
Figure 1 plots changes in the Northern Ireland hourly median gender pay gap (excluding overtime) for FT employees since between 1999 and 2019. The figure shows that, using this measure, the difference in male and female pay has moved from males earning 13.4% per hour more than females in 1999, to females earning 2.9% more than males in 2019. This reverse gender pay gap has existed in NI for ten years. In the UK as a whole, males working full-time earned 8.9% more than FT female workers 2019.
As noted above, there are a number of ways to measure the gap between male and female pay. Figure 2 illustrates NI GPG over different employment periods. It also shows the how the GPG differs in the public and private sectors in NI.
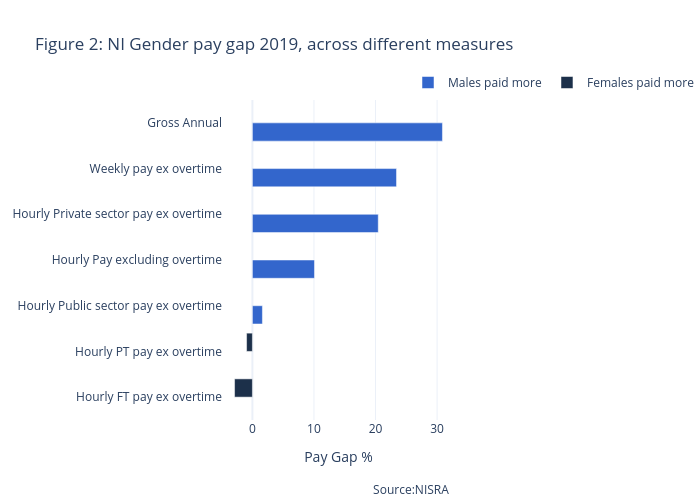
As we see from Figure 2, there is considerable variation in the gap between male and female pay. There is a GPG in terms of gross annual pay, weekly pay, hourly pay for all employees, hourly private sector pay and hourly public sector pay. Indeed in terms of gross annual pay, this is quite signicant – i.e. females earn 30.9% less than males.Hourly pay for all employees also shows a signficant gap; with male employees earning 10.1% more than female employees. NISRA explains that the main reason for this is due to the ‘part-time effect’:
The inclusion of part-time employees increases the gender pay gap as part-time employees earn less on average than full-time employees […] and a higher proportion of part-time employees are women.
In other words, because more females occupy more PT jobs than males, and those jobs tend to be lower paid than FT jobs, this produces an overall effect of increasing the hourly GPG between all male and female employees (both FT and PT). This NISRA animation explains this in more detail.
However, when we look at hourly pay separated out into FT and PT employment, the picture becomes more complicated: both FT and PT produce a GPG in favour of female employees.
The data shows that the 2019 median hourly female FT pay – excluding overtime – was 2.9% greater than the male equivalent. Similarly, median hourly female PT pay – excluding overtime was 0.9% greater than the male equivalent.
Figure 2 also shows the gender pay gap to be much greater in the private sector (20.4% in favour of male employees) than the public sector (1.6% in favour of male employees). Drilling down in the data shows even greater variation in male and female pay across industries and occupations.
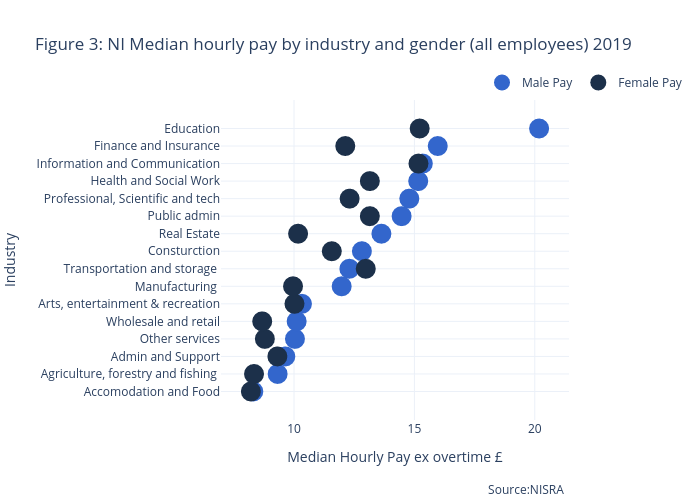
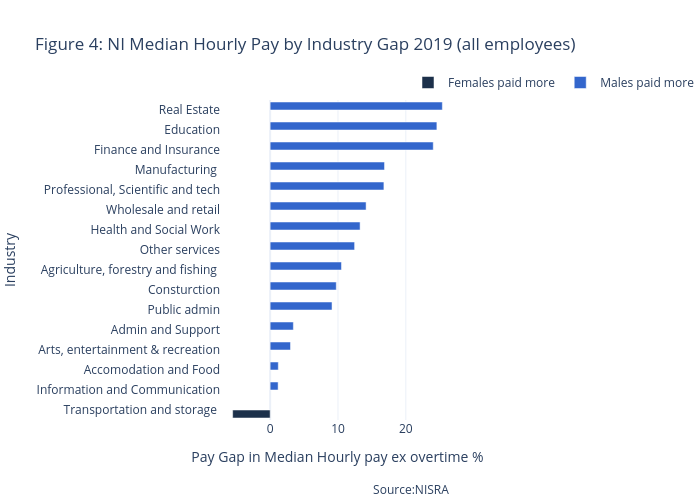
Figures 3 and 4 present the difference in median male and female hourly pay across standard industrial classification (SIC) of economic activities in two different ways. Figure 3 compares actual 2019 median male and female hourly pay – excluding overtime – for all employees in cash terms; whereas Figure 4 presents percentage pay gap in each sector. As can be seen from both these figures, the widest gap between male and female pay in 2019 was in the education sector, where male employees earned £4.96 (24.6%) per hour more than female employees. Significant gender pay gaps in favour of males existed in the following sectors: Finance and Insurance (£3.84, or 24%, in favour of male employees); Real Estate (£3.46, or 25.4%); Professional, Scientific and Technology (£2.48, 16.8%); Manufacturing (£2.02, or 17%); and, Health and Social Work (£2.01, or 13.3%). The only sector in which females earned more than males in 2019 was in the Transportation and Storage sector. Therein, females earned slightly more than males – £0.68, or 5.5% more per hour.
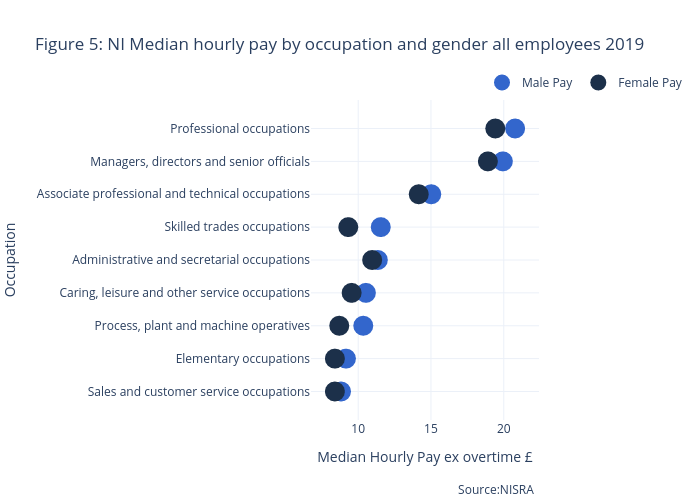
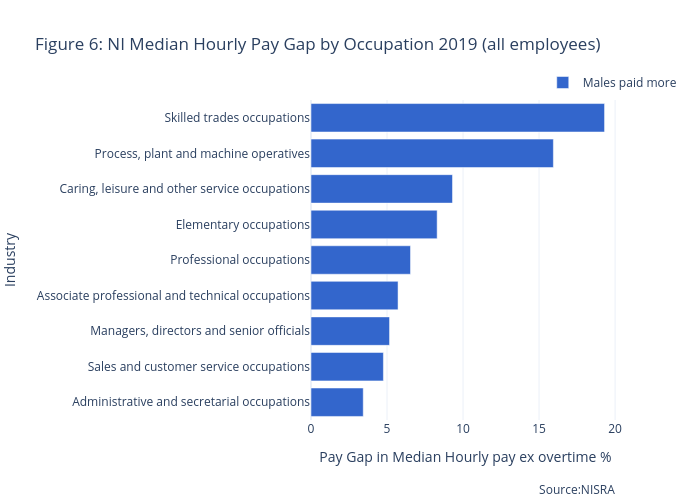
 Figures 5 and 6 present similar information to that presented in Figures 3 and 4, but examines standard occupation classifications rather than industry. It is noticeable that measuring according to occupation type identifies smaller pay gaps between all male and female median employ pay – excluding overtime – on an hourly basis in 2019, than the gaps identified at industry level. As can be seen from Figures 5 and 6 females earned less than males across all occupations in 2019. The widest pay gap in both cash and percentage terms was in skilled trade occupations (£2.06 per hour, or 17.5%). According to NISRA, 94% of those employed in skilled trade occupations are male. The narrowest gap was in administrative and secretarial occupations, where male employees earned £0.86 or 5.7% more than females.
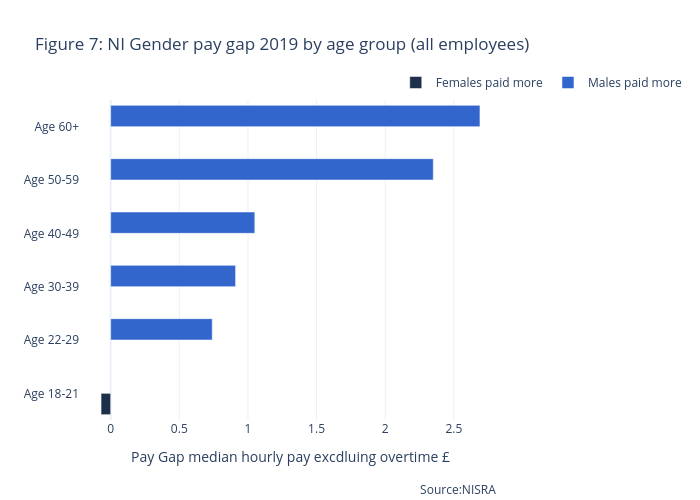
 The final figure, Figure 7, looks at the variation in male and female pay across different age brackets. Again, the Figure looks at median hourly pay for all employees – excluding overtime – in 2019. It presents the age groups in accordance with the size of the pay gap. The figure shows that the GPG increased as the age range employees increased. To this end, female employees earned slightly more than male employees did (£0.07 or 0.9%) in the 18-21 age range. In every other age range, male employees earnt more than female employees. In the 22-29 age range male employees earnt £0.074 per hour more (6.9) and this increased to £2.69 more in the 60+ age range (21.2%).
To conclude, it is evident that using NISRA’s headline measure of the GPG in Northern Ireland – i.e. the difference in median FT male and female hourly pay, excluding overtime – females were paid more in Northern Ireland than males in 2019. This is contrary to the UK as a whole, when using the headline measure. However, to avoid a distorted perception of the GPG in Northern Ireland, there is a need to look beyond the headline figures, which does reveal a more complicated picture. That more considered examination reveals that the differential between male and female pay significantly varies depending on the measure used, and the group examined, e.g. sectors, occupations and age groupings.