
Following on from the discussion in our last blog post – Defining arts and culture in Northern Ireland – Members may wish to consider the financial structures underpinning Northern Ireland’s cultural sector. Scrutinising the allocation of resources is a potential consideration for interpreting the Department for Communities Heritage, Culture and Creativity Framework and for assessing the relationship between investment, participation, and policy outcomes.
Data sources
Building on the definitions and frameworks introduced in the first blog article, the following data sources underpin the analyses presented here and in the accompanying data visualisations on public expenditure on cultural services and public investment in the arts in Northern Ireland. It includes several sources:
- HM Treasury (HMT) Public Expenditure Statistical Analyses (PESA) classifications of cultural services
- Department for Communities (DfC) Annual Report and Accounts 2024/25
- Arts Council Northern Ireland (ACNI) Annual Investment Survey (AIS)
- The State of the Arts, Campaign for the Arts and Centre for Cultural and Media Policy Studies, University of Warwick, July 2024
Together these datasets show different examples of public investment in cultural activity, and the complexity in comparing investment in cultural activities in Northern Ireland with England, Scotland and Wales.
Defining investment, expenditure, income and budgets
Acknowledging the differences between the terms investment, expenditure, income and budgets is important when comparing figures related to cultural and arts activities across the UK.
- Expenditure refers to what government or public bodies actually spend on cultural services each year.
- Investment focuses on targeted funding intended to support artistic activity, such as grants to organisations or artists.
- Income describes the money arts organisations receive from a mix of public, private and earned sources, revealing how they sustain their operations.
- Budgets, meanwhile, set out planned spending in advance and indicate government priorities, even if the final outturn differs from what was estimated.
Considering these measures together helps build an understanding of how resources flow into the arts sector and what they ultimately support. Also, language matters. In feedback and engagement sessions for its new strategy, Arts Council NI found that participants from the arts sector preferred the term ‘investment’ rather than ‘funding’.
Exchequer grant-in-aid outturn
Another element of public support for the arts is the exchequer grant‑in‑aid outturn, representing the actual amount allocated by the Department for Communities to the Arts Council of Northern Ireland (ACNI) each year. This is money provided directly by the Department for Communities to ACNI to support its ongoing functions such as its annual investment in arts organisations.
Underpinned by the Arts Council (Northern Ireland) Order 1995, as an Arm’s Length Body, ACNI is intended to operate with a degree of independence from ministers.
According to UK Government guidance, grant‑in‑aid is typically used when government departments want to publicly fund a body without tightly prescribing how every pound must be spent, giving the organisation flexibility to manage its activities in line with its remit. It differs from standard project‑based grants, which are usually more stringently defined for specific activities. Official guidance notes that ‘grant‑in‑aid’ sits outside the rules for competitive general grants and is governed instead by principles in Managing Public Money. Members may wish to consider the extent to which this guidance has been implemented in practice.
Income mix
As set out in Table 1, annually funded arts and cultural service providers in the UK receive a mix of private and public sources of income.
Table 1: UK arts and cultural services income mix
| Public income | Private (from individuals, charities or private companies) | |
| Central (DCMS) and devolved (DfC) government | Contributed income | Earned income |
| Local council | Grants from trusts and foundations | Ticket sales |
| National Lottery funds | Donations, gifts and legacies | Food, drink and merchandise sales |
| The BBC licence fee | Sponsorships | Space hire |
| Other public sources | ||
| PEACE Plus | ||
| Shared Island | ||
Source: Adapted from The State of the Arts, Campaign for the Arts & Centre for Cultural and Media Policy Studies, University of Warwick, July 2024
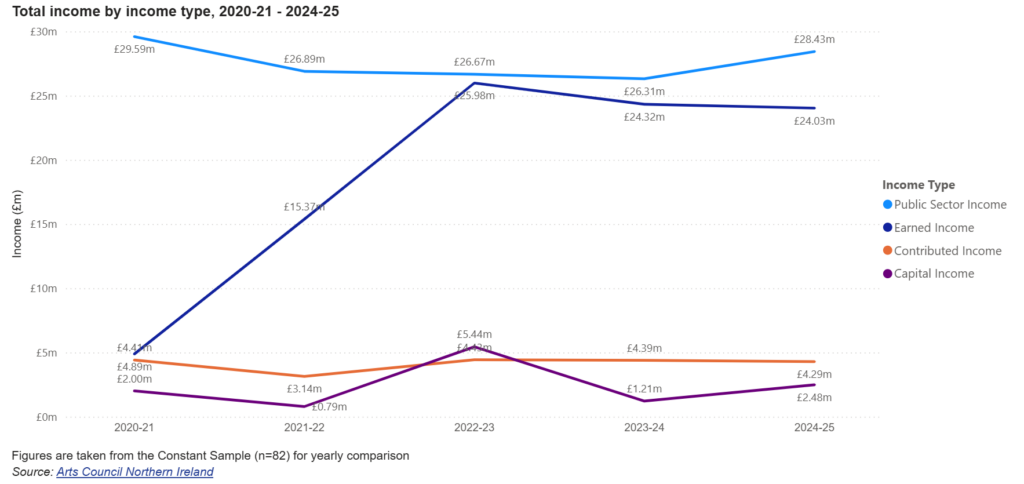
The HCC framework for arts suggests that increased contributed income for arts organisations, such as philanthropic funding, should be a consideration moving forward. Figure 1 illustrates how the balance of income types has changed over time, highlighting shifts between public, private and earned income streams. Where public and contributed income has been relatively flat over time, earned income is beginning to decrease again after a sharp rise following the COVID-19 pandemic.
The income mix demonstrates how ACNI’s annually funded organisations rely on a combination of public, private and earned sources, whereas PESA data shifts the focus to cross‑jurisdictional differences in public expenditure on cultural services, allowing Members to compare Northern Ireland’s position within the wider UK context.
What PESA measures and why it matters
PESA (Public Expenditure Statistical Analyses) provides a UK‑wide classification of public expenditure. ‘Cultural services’ includes arts venues, museums, libraries, archives, heritage, and sometimes community or tourism‑related spending. Because of this breadth, PESA figures capture much more than direct support for artistic production.
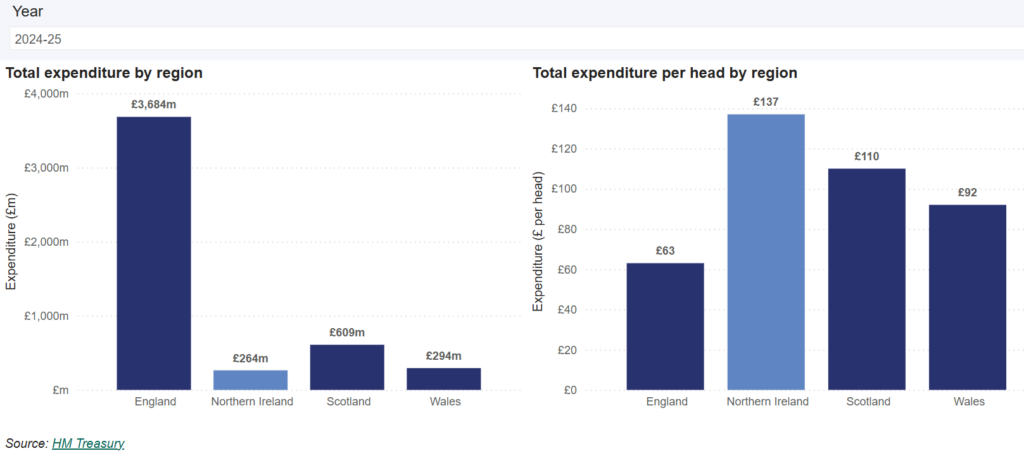
Northern Ireland appears to spend proportionately more on cultural services than England, Scotland or Wales. However, PESA’s broad categorisation can obscure the reality of direct arts funding. According to University of Warwick research, public expenditure on grant‑in‑aid per head of the population for 2022/23 was around £6.99, and the lowest in the UK.
Maintenance vs creative production
High cultural spending does not necessarily mean strong support for artistic activity. High cultural services spending can mask underlying fragility if investment goes primarily to buildings and infrastructure rather than creative production. Members may therefore wish to distinguish between:
- Maintenance spending (museums, libraries, heritage, venues), and
- Creative production funding (artists, arts organisations, festivals, community arts)
This distinction is necessary to understanding how Northern Ireland compares with other UK nations and what its funding levels actually support. Broad categorisation in expenditure data can make it difficult to determine how much investment:
- Reaches artists directly
- Supports heritage, libraries or museums
- Aligns with the Framework’s missions: People, Planet, Prosperity and Peace
Members may find value in:
- Clearer breakdowns of cultural services expenditure
- Better differentiation between infrastructure and creative production
- Further scrutiny of how funding responsibilities differ across UK nations and the implications for NI’s comparative position
Recognising the difference between maintaining venues and investing in artistic activity underscores the importance of looking at direct arts investment to assess how resources support core creative work.
Direct arts investment
When looking specifically at direct public investment in the arts, rather than broader cultural services, a different picture emerges. Table 2 demonstrates how direct public investment by the Department for Communities in ACNI is substantially lower than in the other UK nations. For 2024/25:
- NI: £12.245m grant-in-aid (0.03% of total resource spending)
- Wales: 0.06%
- Scotland: 0.07%
- England: 0.075%
Table 2 Ratio of expenditure on exchequer grant in aid vs total resource spending
| Country and Region Analysis 2024/25 | Total Expenditure £m | Cultural Services £m | Ratio % | Arts Grant in aid outturn for 2024/25 £m | Ratio % |
| Northern Ireland | 31069 | 264 | 0.80 | 12.245 | 0.03 |
| Wales | 48293 | 294 | 0.61 | 30.483 | 0.06 |
| Scotland | 86328 | 609 | 0.71 | 60.742 | 0.07 |
| England | 769898 | 3684 | 0.47 | 578 | 0.075 |
For 2024/25, Northern Ireland spent 0.03% of its total public resource expenditure on ACNI grants, 50% less than England, Scotland and Wales.
However, as outlined in the previous blog article in this series, comparisons must be made cautiously. Other national arts bodies have broader remits, for example:
- Creative Scotland includes moving image
- Arts Council Wales includes school-based arts programmes.
These structural differences mean that headline per‑capita comparisons do not always reflect differences in core arts activity.
What ACNI’s Annual Investment Survey shows
ACNI’s Annual Investment Survey provides a detailed view of organisations annually funded by ACNI. It covers public, private, and earned-income sources, including:
- Central and local government
- National Lottery funds
- Trusts, foundations, donations
- Ticket sales, merchandise and space hire
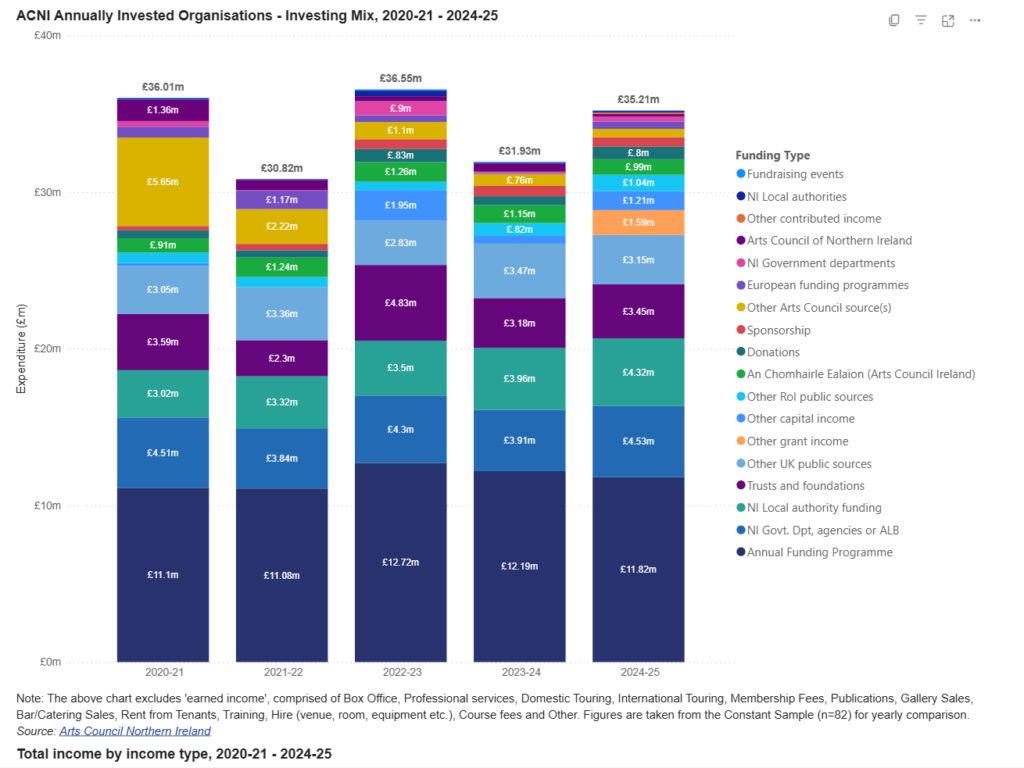
In 2024/25:
- ACNI investment accounted for approximately one‑third of total public and contributed income
- Local councils contributed over 10%, and public investment totalled over 50% of total investment sources, illustrating a key vulnerability as Northern Ireland’s exchequer faces increasing budget pressures.
Arts activities
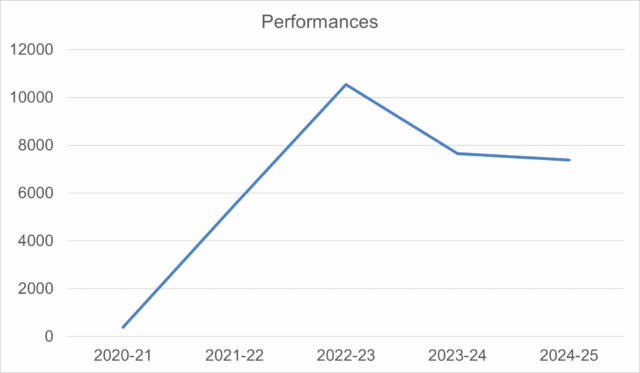
Although the investment survey highlights the sources sustaining ACNI‑funded organisations, the next section shows that the number of performances produced by ACNI annually funded organisations has fallen from its 2021–22 and 2022–23 highs, indicating reduced activity levels.
Summary
Northern Ireland’s cultural spend appears high under PESA, but this reflects a broad definition covering heritage, libraries and museums. In reality, Northern Ireland allocates the lowest level of direct arts funding in the UK, at 0.03% of total resource expenditure. However, structural differences across UK arts bodies complicate comparisons.
ACNI annual investment survey data shows that its annually funded arts organisations rely on public investment from ACNI, local councils and other Northern Ireland Department sources, exposing them to financial instability. Clearer distinctions between maintenance and creative production funding, and improved expenditure categorisation, would support Members in future scrutiny and policy development. This reinforces that when comparing financial information, the importance of distinguishing between expenditure, investment and other sources of income outlined at the start of this article.
Overall, the contrast between the funding landscape and the fall in performances highlights the need to consider not only how arts organisations are resourced, but whether investment levels are adequate to sustain artistic activity in practice.