Please note that the Constituency Profiles have been updated with a new layout and are available on a new page here.
The Research and Information Service (RaISe) has just produced updated 2016 Constituency Profiles for each of the 18 constituencies in Northern Ireland. This article looks at why and how these profiles are produced.
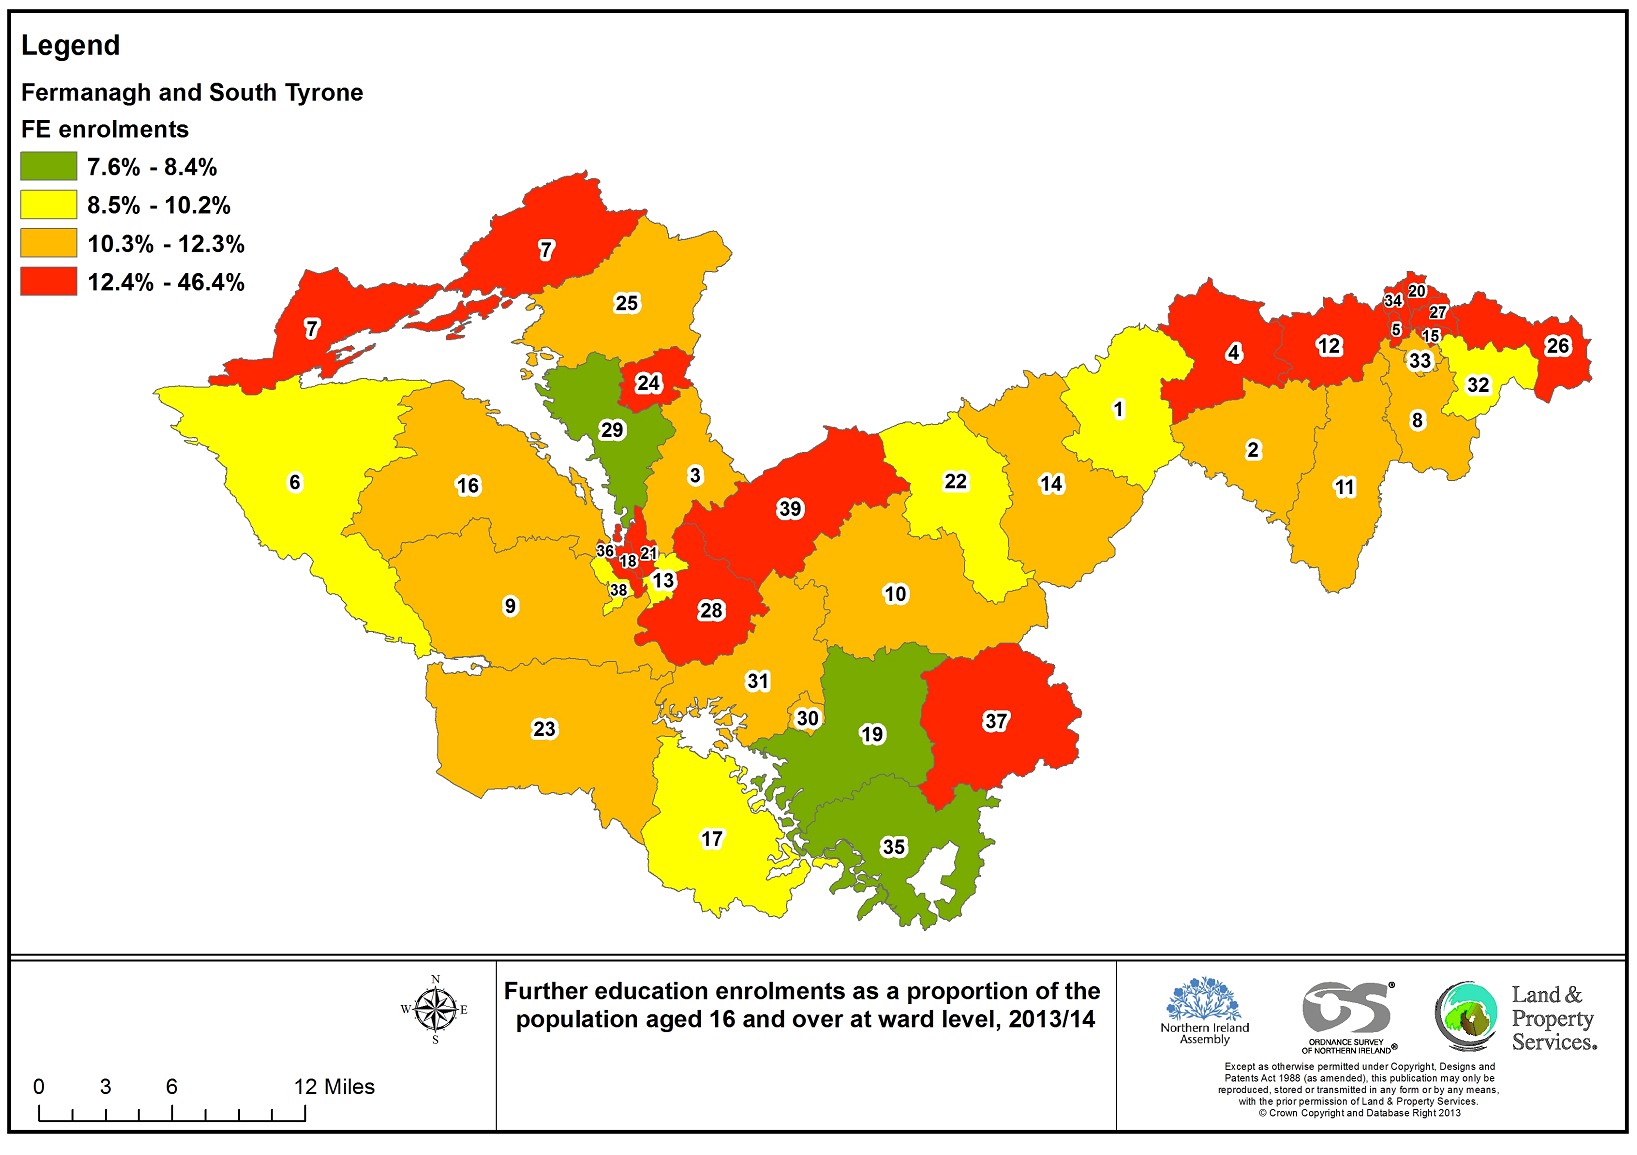
Map of Fermanagh and South Tyrone highlighting further education enrolments as a proportion of the 16+ population for 2013/14
Please note: we have posted a new version of this blog article using the most recent data, see here.
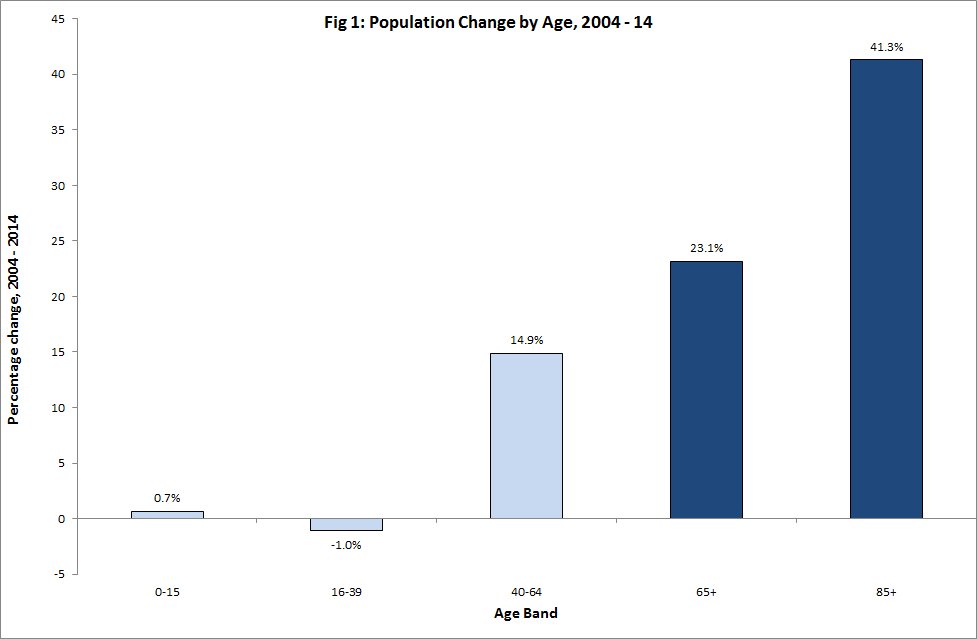
This article presents a brief demographic profile of Northern Ireland, showing emerging trends in the population, and comparisons with other United Kingdom (UK) countries, the Republic of Ireland, and the European Union (EU).
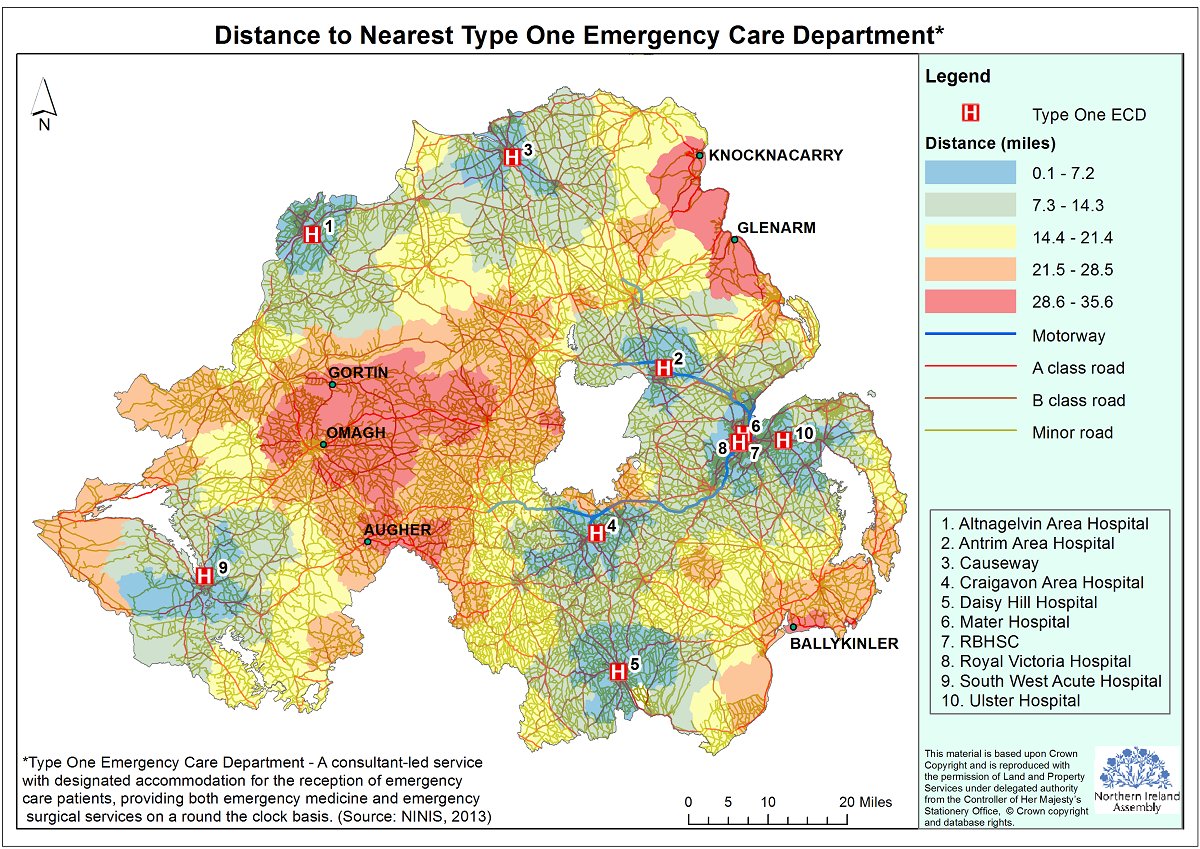
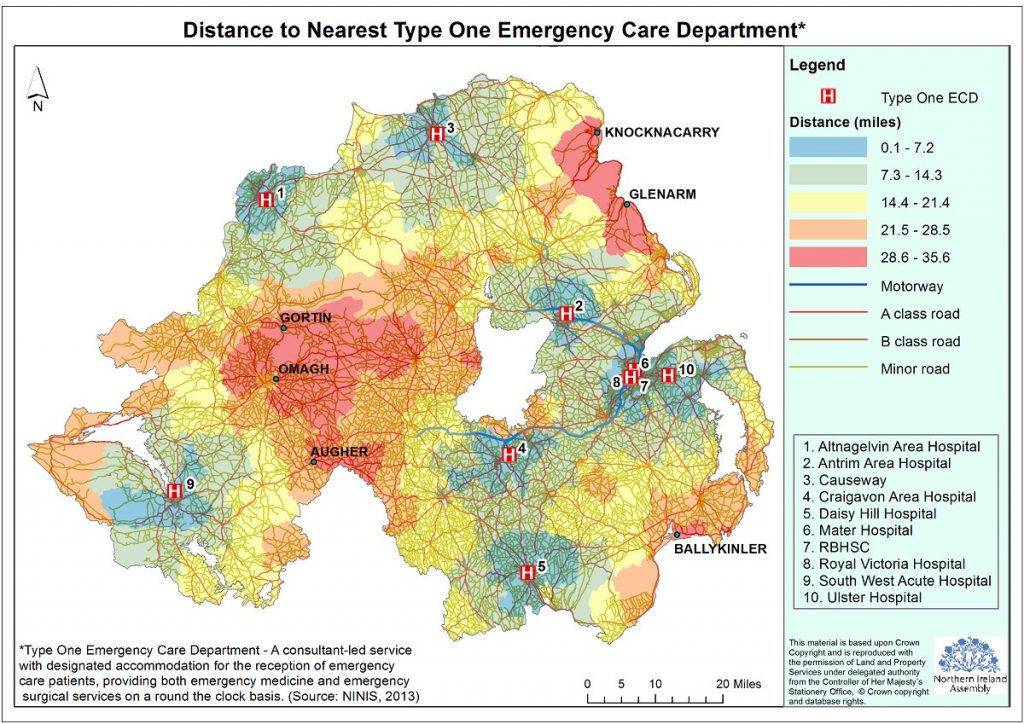
Figure 1: Map presenting time travel analysis in relation to the nearest type one emergency care department
Everything happens somewhere. How does the Northern Ireland Assembly’s in-house geographic information service help Members analyse and visualise complex data?
Over 80% of data used by our public sector services – environment, health, education, security, construction, transport, agriculture, heritage, sport and employment – has a geographic element e.g. an address or a coordinate. All these can be mapped. The advantage of mapping information rather than producing a table of information is that it allows users to easily review, analyse, visualise and understand previously unseen patterns, gaps, issues or problems. Analysing data in this way can lead to improved decision making. Examples of the kinds of geographical analysis produced by the Research and Information Service can be seen in figures 1 and 2.