Election 2016: An analysis of results and transfers
Yesterday, we published a post which examined the 2016 Assembly election results in terms of candidates and voter turnout. This post, the second in the Election 2016 series, will focus on the results of that poll. The article is based on a more detailed report on Election 2016 by the Research and Information Service, which can be viewed here.

Table 1 shows the overall result of the Assembly Election 2016. The two main unionist parties (DUP and UUP) returned to Stormont with the same number of seats as before the election (38 and 16 respectively), albeit with a slightly smaller share of first preference votes than in 2011. By contrast, the two largest nationalist parties (Sinn Féin and the SDLP) lost three seats overall, and saw a significant drop in their share of the vote (down 2.9 and 2.2 percentage points respectively). The smallest of the five main parties (Alliance) retained their previous eight seats, but with a marginally smaller share of the vote (down 0.7 percentage points).
| Party | Seats | +/- % | First Preference Votes |
Vote Share (%) |
+/- % |
| DUP | 38 | 202,567 | 29.2 | -0.8 | |
| Sinn Féin | 28 | -1 | 166,785 | 24.0 | -2.9 |
| UUP | 16 | 87,302 | 12.6 | -0.7 | |
| SDLP | 12 | -2 | 83,368 | 12.0 | -2.2 |
| Alliance Party | 8 | 48,447 | 7.0 | -0.7 | |
| TUV | 1 | 23,776 | 3.4 | 0.9 | |
| Green | 2 | 1 | 18,718 | 2.7 | 1.8 |
| PBPA | 2 | 2 | 13,761 | 2.0 | 1.2 |
| UKIP | 0 | 10,109 | 1.5 | 0.8 | |
| PUP | 0 | 5,955 | 0.9 | 0.6 | |
| Conservative | 0 | 2,554 | 0.4 | 0.4 | |
| Independent | 1 | 22,650 | 3.3 | 0.9 | |
| Others | 0 | 8,322 | 1.2 | ||
| Total | 108 | 694,314 | 100.0 | 0.9 |
Table 1: Assembly Election 2016 – Overall Results
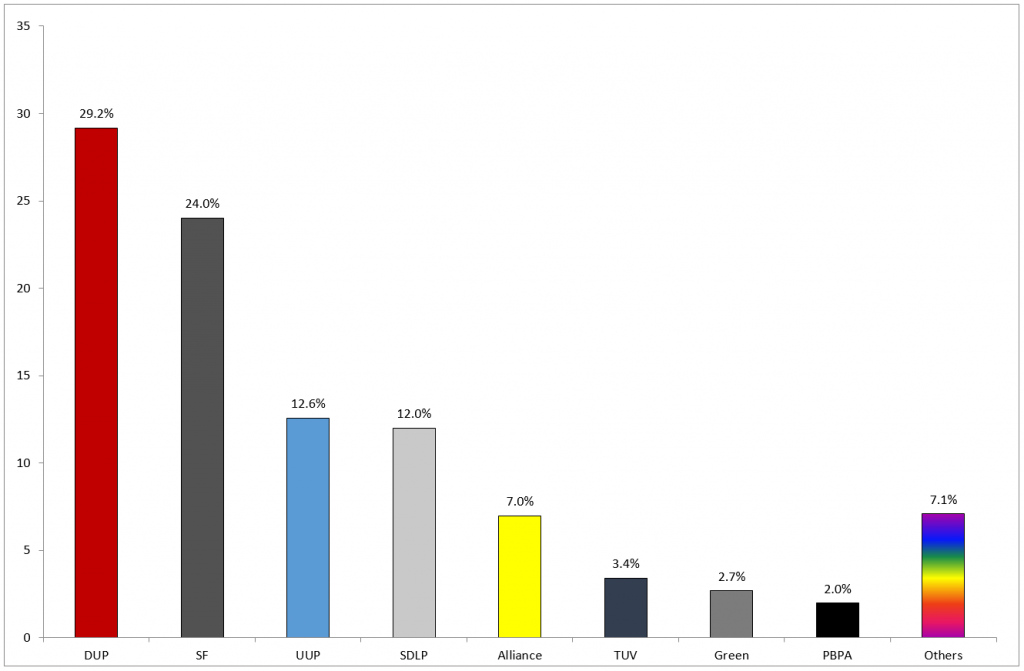
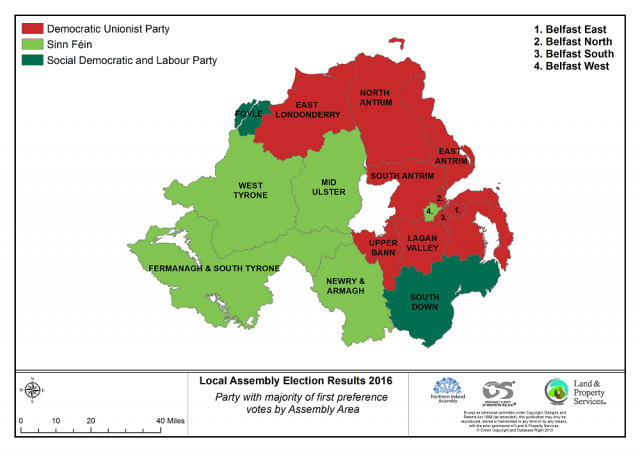
Figure 1 shows the proportion of first preference votes obtained by the five main parties, plus selected others, while Map 1 illustrates the party with the largest share of first preference votes in each constituency.

Map 1 also illustrates the dominance of the unionist parties (notably the DUP) in the North and East of Northern Ireland, and of the nationalist parties (particularly Sinn Féin) in the West and South.

Nationalist Share of the Vote
A feature of Election 2016 was the decline in the nationalist share of the vote. Table 2 shows the combined Nationalist vote (Sinn Féin and SDLP) at all five Assembly elections since 1998.
| SF | SDLP | Combined | |||||
| % | Count | % | Count | % | Count | Seats | |
| 1998 | 17.6 | 142,858 | 22.0 | 177,963 | 39.6 | 320,821 | 42 |
| 2003 | 23.5 | 162,758 | 17.0 | 117,547 | 40.5 | 280,305 | 42 |
| 2007 | 26.2 | 180,573 | 15.2 | 105,164 | 41.4 | 285,737 | 44 |
| 2011 | 26.9 | 178,224 | 14.2 | 94,286 | 41.1 | 272,508 | 43 |
| 2016 | 24.0 | 166,785 | 12.0 | 83,364 | 36.0 | 250,149 | 40 |
Table 2 Nationalist Share of Vote (%), Assembly elections, 1998 – 2016
The table illustrates the substantial drop in the nationalist vote, from 320,821 in 1998 to 250,149 in 2016, a fall of 22 per cent. This is reflected both in the number of seats (down from 44 to 40) and the nationalist share of first preference votes (from a peak of 41.4% in 2007 to 36.0% in 2016). Although not shown in Table 2, the nationalist vote also fell in the three election prior to 2016 – in the 2014 local council election (37.7%); the 2014 EU election (38.6%); and the 2015 Westminster election (38.4%).
The table also clearly shows the decline in the SDLP Assembly vote since 1998, which dropped from a peak of 177,963 (24 seats) in 1998 to a low of 83,364 (12 seats) in 2016, a fall of over half (53%).
Transfers
In a Single Transferrable Vote (STV) election, the second and subsequent preferences of those candidates who are either elected or eliminated are transferred to other candidates. In the 2016 Assembly Election, only 17 MLAs had a sufficient number of first preference votes to meet the quota and to be elected at the first count. The remaining 91 were elected at a later stage and required transferred votes. A detailed report on transfers in Election 2016 can be viewed .
A total of 179,287 votes were calculated as transfers during the 2016 Election count. The total includes transfers which were treated collectively during the counting process (this occurred when two or more candidates were eliminated at the same stage). Further, the figures should be considered as indicative of the transfers that were calculated during the actual count process, and cannot account for the preferences of all ballots cast in a constituency.
In summary, of the parties elected, the UUP received most transferred votes (25%), followed by the DUP (22%), Sinn Féin (14%), SDLP (13%), Alliance (11%), Green Party (4%), TUV (3%) and People Before Profit Alliance (1%).
Table 3 contains a breakdown of the transfers received by the five main parties. A major source of such transfers is from other candidates of that party in the same constituency. The table shows that Sinn Féin candidates acquired the largest share of transfers from their own party (61%) and had the smallest proportion of transfers from other parties (39%).
| Transfers from Own Party (%) |
Transfers from Other Parties (%) |
|
| Sinn Féin | 60.9 | 39.1 |
| DUP | 41.5 | 58.5 |
| Alliance | 28.9 | 71.1 |
| UUP | 24.4 | 75.6 |
| SDLP | 21.4 | 78.6 |
Table 3 Breakdown of Transfers to Five Main Parties, Election 2016
In contrast, Alliance, UUP, and the SDLP received the lion’s share of transfers from other parties (71%, 76% and 79% respectively). The DUP received 59% of its transfers from other parties.
Constituency Boundaries
In accordance with the Parliamentary Voting System and Constituencies Act 2011, the number of Parliamentary constituencies across the UK will be reduced from a current 650 to 600. Northern Ireland will lose one seat, down from 18 to 17, at the next Westminster elections, expected in 2020. This will mean redrawing the existing constituency boundaries.
The 2018 Review of Parliamentary constituencies started on 24 February 2016. The Boundary Commission for Northern Ireland has just submitted its provisional report (September 2016) which has gone out to consultation. Final recommendations to the Secretary of State for Northern Ireland are due no later than 1 October 2018.
Under current proposals, Belfast is to lose one of its four seats (Belfast West), while the remaining three will be redrawn and renamed as Belfast North West, Belfast South West, and Belfast East. Constituencies outside Belfast will also be heavily modified and renamed.
The new Westminster Parliamentary Constituency boundaries will also be adopted for the next Assembly Election in 2021. With five Members to be elected per constituency, this will reduce the size of the Assembly from 108 Members to 85.
Conclusion
Election 2016 resulted in some subtle adjustments to the electoral landscape. For unionist and the Alliance parties it was ‘steady as you go’, with no change in the number of seats, while the nationalist parties lost three seats to the smaller, fringe parties (PBPA and Greens). Turnout was down, notably in nationalist constituencies, and all five main parties saw their share of the vote decline compared with 2011. Sinn Féin and the SDLP experienced the largest fall in first preference votes (2.9 and 2.2 percentage points respectively).
The proposed boundary changes, coupled with a reduction in the number of Assembly seats, are likely to result in further adjustments to the electoral landscape in the 2021 election.


