This post examines financial support provided by Invest Northern Ireland (Invest NI) to businesses located in Northern Ireland (NI) from 2013-14 to 2017-18, identifying key impacts arising from that funding.
What is Invest NI?
As is widely known, Invest NI is a non-departmental public body (NDPB), which aims to:
Support business development, help to increase productivity and export levels, attract high quality inward investment, and stimulate a culture of entrepreneurship and innovation.
A major component of its activity is funding to support export focussed business projects within NI, existing or proposed. Two publicly available sources to examine Invest NI financial support to business are:
- Open Data NI website: In July 2018, Invest NI published 5 years of its financial offers to businesses for the financial years 2013-14 to 2017-18 via a new online database, enabling access to comprehensive datasets on those offers and greater scrutiny in this area, e.g. users can identify companies receiving the greatest amounts of funding. This was the second time Invest NI published data on its financial offers to businesses; in November 2017 it published that data for the financial years 2012-13 to 2016-17;
- Invest NI Annual Performance Reports: Invest NI annually releases data on offers, assistance, jobs, and investment as part of their year-end year performance reporting.
This post relies on those sources when considering questions identified in the following paragraphs.
How much financial support has Invest NI offered?
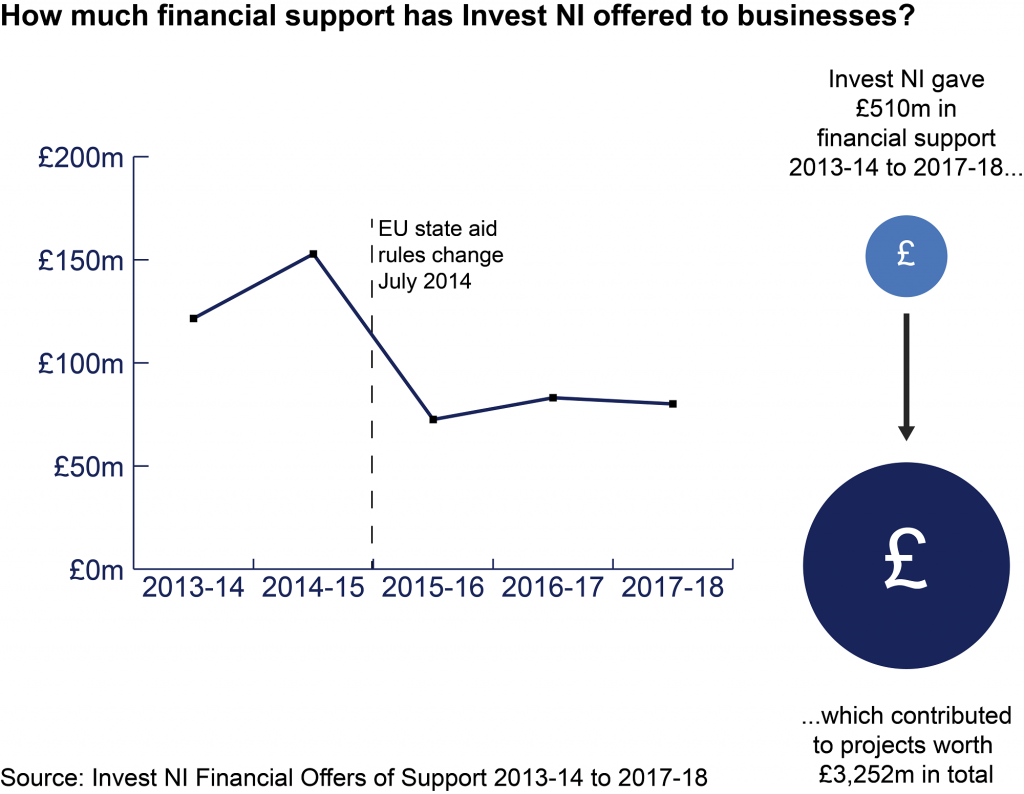
According to the Open Data figures, Invest NI provided a total of £510.13 million (m) in financial assistance over the period 2013-14 to 2017-18. This assistance was provided to projects that had been costed at £3,252.25m. (The £510.13m does not reflect all financial assistance paid out by Invest NI. Rather, it includes only money given to businesses, not other organisations such as external delivery organisations or universities. The total figure also excludes projects that Invest NI plans to announce publically on a future date and any commercially sensitive projects.)
Nonetheless, a comparison of the 2015-16 open data figures to those in 2014-15 indicates a clear drop in the total funding provided by Invest NI to businesses situated in NI. This reduction can be largely explained by two types of European State Aid regulatory change, both effective in 2014.
First, the funding amount that Invest NI could lawfully award to businesses located in NI was reduced in 2014, following on from State Aid ceiling reductions introduced in earlier years in parts of NI. Briefly stated, those changes were:
- In 2011 the aid ceiling was lowered in Inner Belfast, but remained higher in the rest of NI. As a result, the funding amount that could be awarded by Invest NI to business in Inner Belfast decreased. (This followed on from 2007 to 2010, when the maximum State Aid amount that could be lawfully provided to business was the same throughout NI.)
- In 2014 the aid ceilings for the rest of NI were lowered, bringing them in line with those applicable in Inner Belfast. As a result, the funding amount that could be lawfully awarded by Invest NI to businesses situated throughout the rest of NI decreased that year.
The second change to European State Aid regulations in 2014 restricted Invest NI’s ability to fund large (250+ employees) companies – both indigenous and foreign – which had sought to expand in the same work area(s) and on the same work premises. This regulatory change marked a departure from what Invest NI previously had sought to do.
Businesses located in NI anticipated the outworking of the stated regulatory changes. They consequently accelerated their expansion plans throughout 2014-15, which resulted in a spike in the funding Invest NI provided to businesses. As a result, the 2014-15 figures – when the old European regulatory rules applied – are higher, when compared to the 2015-16 figures – when the new rules were in effect.
What are key characteristics of Invest NI client companies?
Invest NI’s open data allows the user to identify key characteristics of Invest NI client companies, including:
- Where they are located in NI;
- What business sectors they belong to; and,
- In what countries are they owned.
Each is individually addressed below.
Where are Invest NI client companies located in NI?
Examining the data at a District Council level, Belfast City Council (BCC) received the largest share of Invest NI funding from 2013-14 to 2017-18: receiving 36.52% of all funding, or £186.30m in total. This could be expected given the relative size and the concentration of businesses within BCC’s boundaries.
Looking at the data on a Parliamentary Constituency basis, it is evident that the areas which received the most Invest NI funding during this period were: Belfast South (which received funding to the value of £909.40 per capita, or £104.03m in total over the period), Belfast East (£552.51 per capita, or £52.59m in total) and Upper Bann (£341.65 per capita, or £43.09m in total). The constituencies that received the least support from Invest NI over the period where Strangford (£103.80 per capita, or £9.48m in total); East Londonderry (£85.14 per capita, or £8.64m in total); and, North Down (£83.47 per capita, or £7.62m in total).
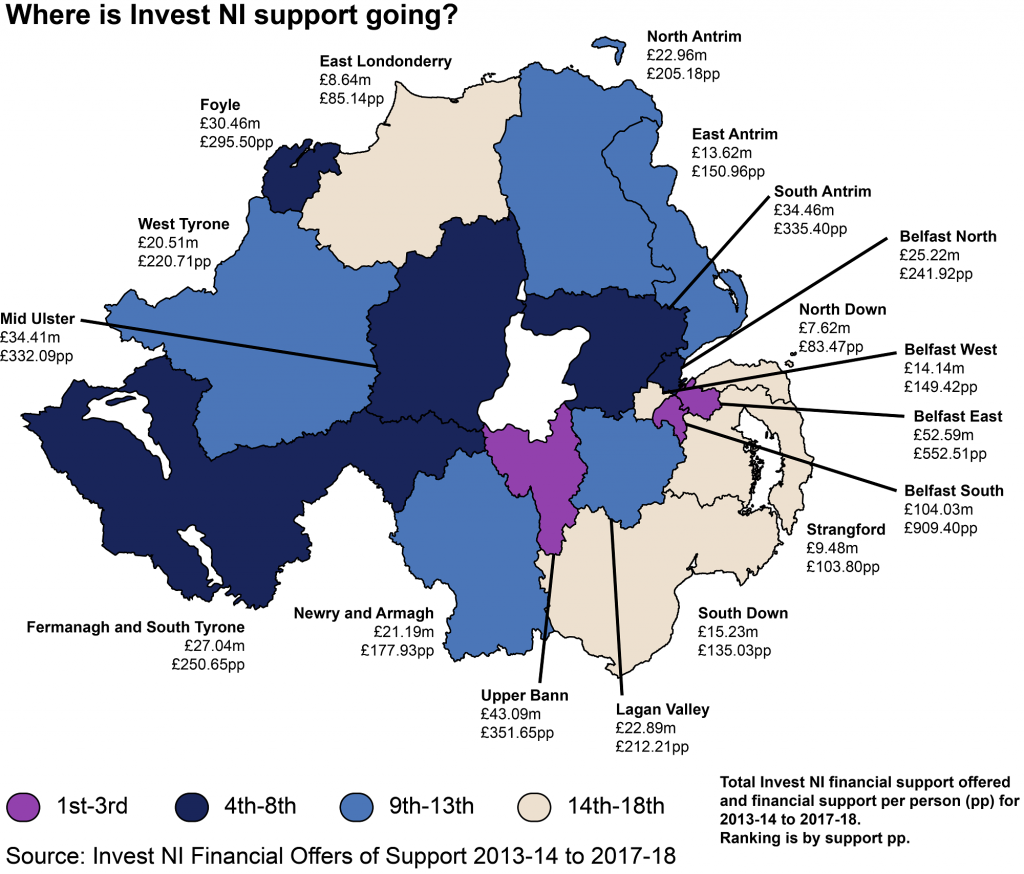
In March 2012, a Northern Ireland Audit Office (NIAO) report examined Invest NI data over the period April 2002 to March 2011 and highlighted an East-West divide in Invest NI’s financial support offered to business. Looking at its data in that area for 2013-14 to 2017-18, it appears that the NIAO East-West finding still holds true: businesses in the East received £386.52m in support, whilst businesses in the West received over £121.06m. This East-West comparison, however, is not entirely meaningful given the large differences in population between the two areas. Addressing the population differences using a per capita basis, the East received £283.83 and the West £237.83 – a 16.21% difference. Whilst the gap decreases significantly when the population variation is accounted for, an apparent sizable gap nonetheless remains.
(For the purpose of this analysis, the ‘West’ was defined as the constituencies: Foyle, East Londonderry, West Tyrone, Fermanagh and South Tyrone, and Mid-Ulster. The ‘East’ was defined as all remaining constituencies.)
Invest NI notes that its offers of financial support are:
…demand-led by businesses seeking the agency’s support to improve their competitiveness and gain a larger share of international markets.
And that:
Where a business chooses to locate will be driven by a number of factors including availability of a skilled workforce, infrastructure, size of land required and the location of similar businesses.
What business sectors do Invest NI client companies belong to?
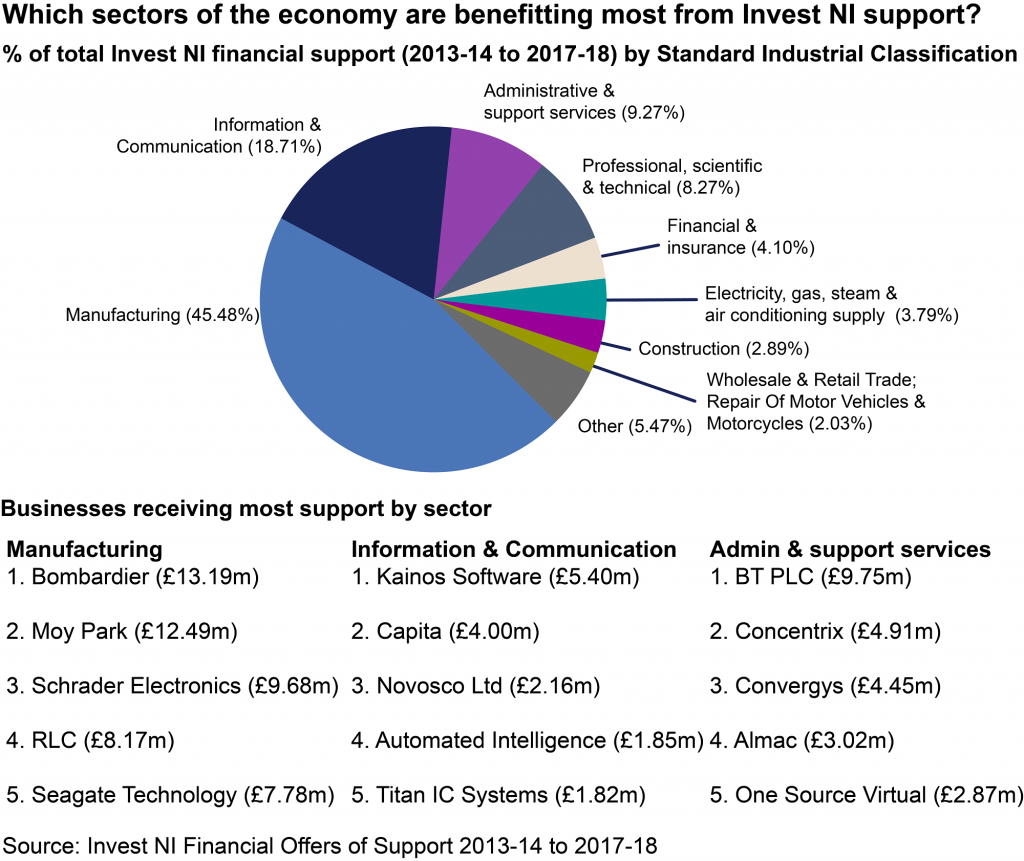
The latest Invest NI Open Data shows that the majority of Invest NI financial support was provided to business involved in manufacturing – £231.99m, or 45.48% of all funding. Seven other sectors received more than £10m in funding over the same period: Information and Communication (£95.45m, or 18.71%); Administrative and Support Service Activities (£47.31m, or 9.27%); Professional, Scientific and Technical Activities (£42.18m, or 8.27%); Financial and Insurance Activities (£20.94m, or 4.10%); Electricity, Gas, Steam and Air Conditioning Supply (£19.32m, or 3.79%); Construction (£14.72m, or 2.89%); and, Wholesale and Retail Trade and Repair Of Motor Vehicles and Motorcycles (£10.33m, or 2.03%).
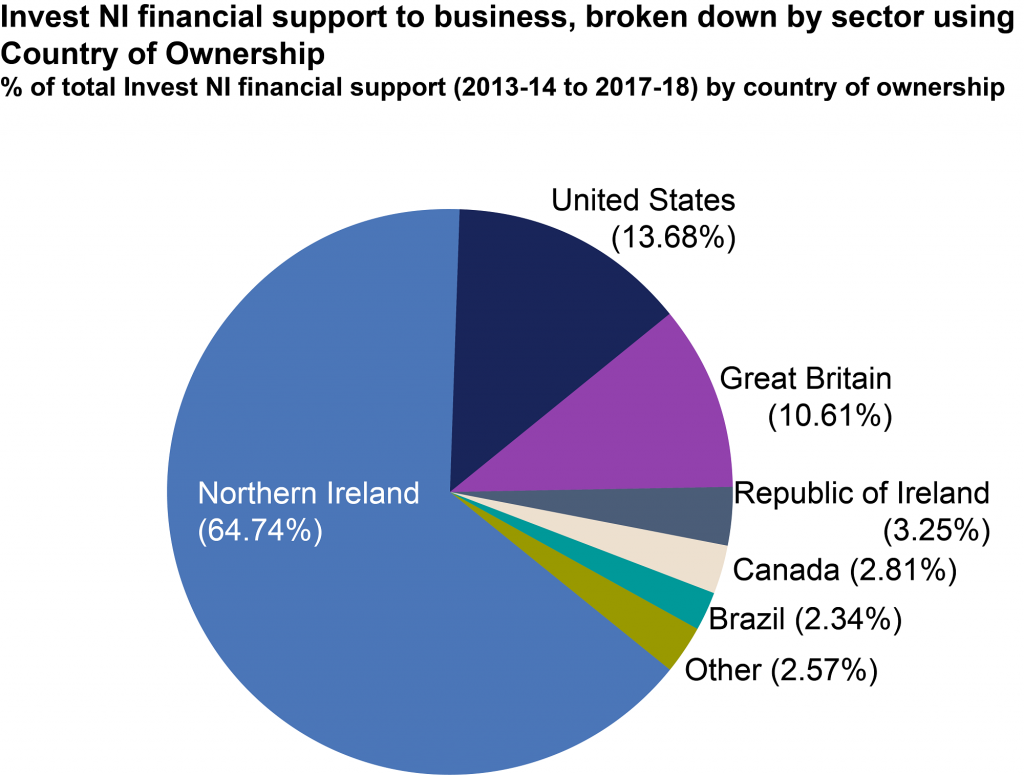
In what countries are Invest NI client companies owned?
According to the Invest NI Open Data, Invest NI provided the majority of its funding to NI-owned companies over the period 2013-14 to 2017-18. A total of £330.26m was provided to companies of NI ownership, this represented 64.74% of all funding provided over the period. For companies owned outside NI, Invest NI provided less funding for this period; a total in excess of £179.87m of its funding for that period. Client companies with ownership outside NI were: United States (£69.78m in funding, or 13.68% of total funding); Great Britain (£54.12m, or 10.61%); the Republic of Ireland £16.60m, or 3.25%); Canada £14.34m, or 2.81%); and, Brazil (£11.94m, or 2.34%).
What purpose was Invest NI business funding offered for?
Invest NI categorised its business financial support into six categories: Creating Jobs/Capital Investment/Business Development; Developing Innovation & Technology; Developing Skills; Investing in Research & Development (R&D); Loan Fund; and, Other.
Over the period 2013-14 to 2017-18, 43.90% of Invest NI’s funding was provided for ‘Creating Jobs/Capital Investment/Business Development’, amounting to £223.95m. Investing in R&D (£118.74m, 23.28%) and the Loan Fund (£85.16m, 16.69%) also received significant support during this period.
What key impacts on jobs have arisen from Invest NI’s financial support to business?
Two metrics used by Invest NI to identify key impacts on jobs of Invest NI’s financial support offered to business are ‘Jobs to be Created (Assisted)’ (as provided on the Open Data NI website) and ‘jobs created’ (as provided on as part of Invest NI’s performance reports).
Jobs to be Created (Assisted)
Open Data NI provides Invest NI figures on ‘Jobs to be Created (Assisted)’, i.e. the number of jobs companies expect to be created in future years as a result of support offered by Invest NI to client companies. That data shows that:
- Belfast South by far had the most Jobs to be Created per capita, with over 84.43 jobs per 1,000 of population.
- Belfast East had the second highest, with 27.30 jobs per 1,000 of population.
- Foyle had the third, with 20.96 jobs per 1,000 of population.
- The three Parliamentary Constituencies with the fewest Jobs to be Created (Assisted)were: East Londonderry, with 4.74 jobs per 1,000 of population; Strangford, with 4.21 jobs per 1,000 of population; and, North Down, with4.02 per 1,000 of population.
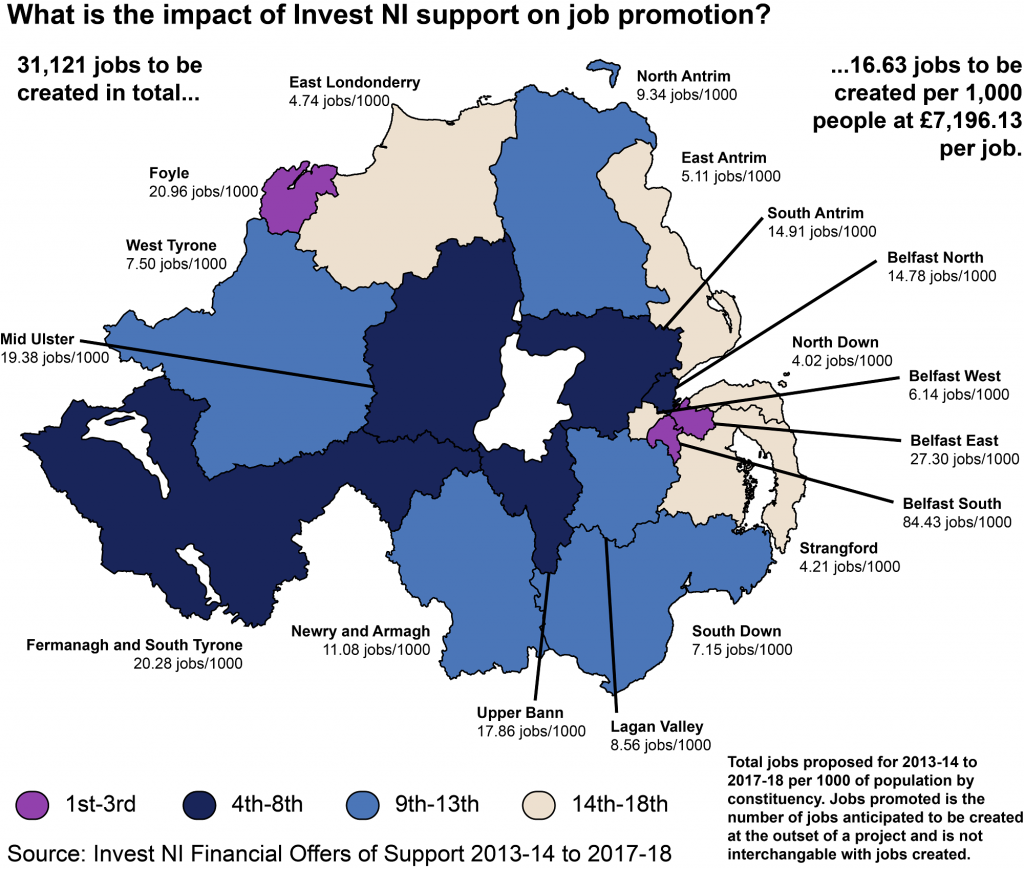
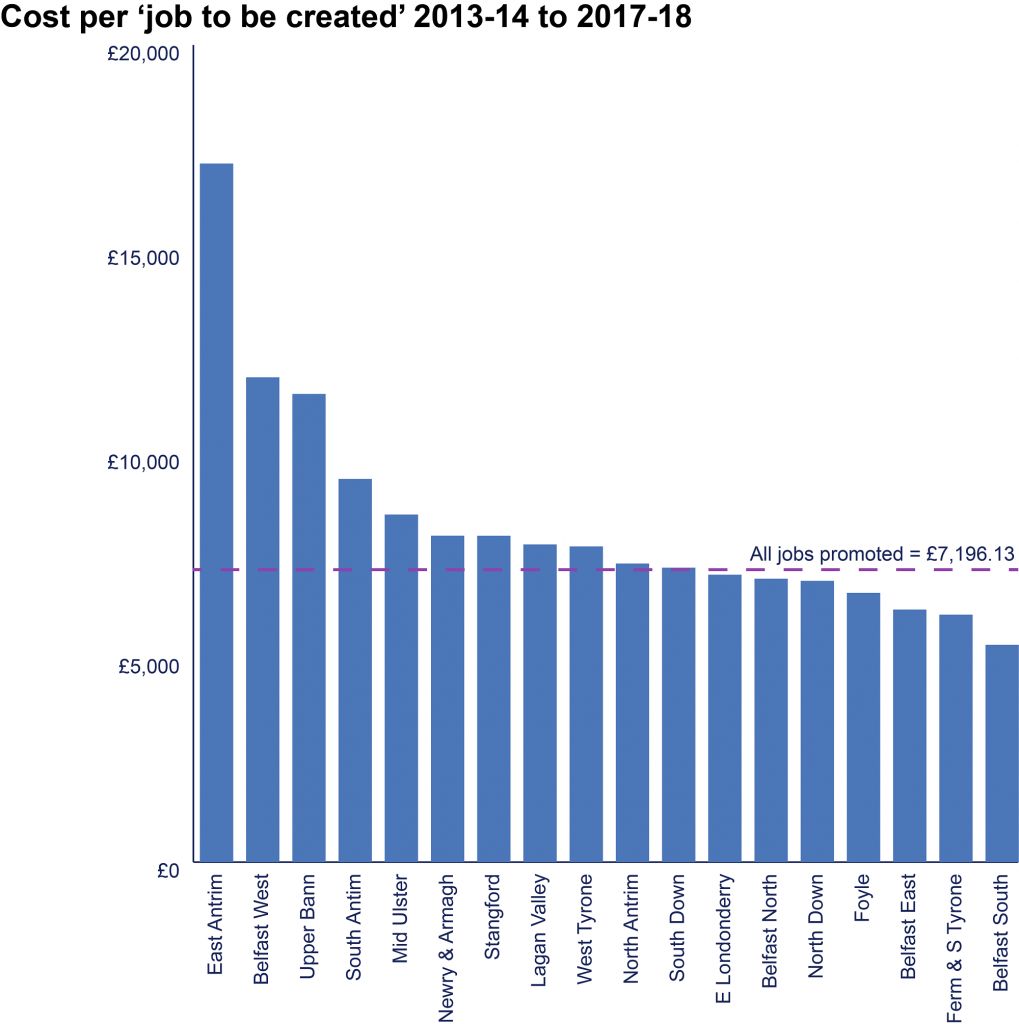
As noted earlier, Invest NI provided £223.95m of support for ‘Creating Jobs/Capital, Investment/Business Development’ over the period examined. Based on this, it seems one job was assisted for every £7,196.13 of Invest NI business funding offered (although it should be noted that as this figure is for Creating Job, Capital Investment and Business Development, not all of the assistance relates to jobs assisted). Relying on that assumption, it seems that:
- Funding offered was most effective in job promotion in: Belfast South (£5,318.89 per job to be created); Fermanagh and South Tyrone (£6,056.48); and, Belfast East (£6,181.34); and,
- The largest funding offered per job to be created was in: East Antrim (£17,097.79); Belfast West (£11,865.44); and, Upper Bann (£11,457.63).
Jobs created
Invest NI Performance Data published in its annual reports historically used the measure ‘jobs created’, i.e. the number of jobs created by Invest NI client companies as a result of support offered by Invest NI to client companies. It did so at both NI and Parliamentary Constituency levels. For example, Invest NI’s Performance 2016/17 reports that a total of 35,046 jobs were created in NI during the period 2012-13 to 2016-17. (It is worth noting that Invest NI’s job created figures are not included within Open Data NI at an individual business level due to commercial sensitivities.)
In 18 June 2018 Invest NI featured an article on its website, which stated:
This year has seen a change in reporting for the organisation. We have moved to Outcome Based Accountability (OBA) which measures the wider impact of our activity.
The article further stated that Invest NI is currently measuring performance over the four-year period 2017 to 2021, with a target of creating 30,000 to 40,000 additional jobs for that period. It also referenced its performance data, which recorded 10,970 additional jobs had been created to date in 2017-18. Unfortunately, for the purposes of this blog post, Invest NI has not yet published a full breakdown of where the 10,970 additional jobs were created by parliamentary constituency. A breakdown by council area is available. This is outlined in Table 1, which shows that the majority of these jobs (3,608, or 33%) were located in the Belfast council area. Mid Ulster, Armagh, Bandbridge & Craigavon, and Newry Mourne also had a significant number of additional jobs created – between 10% and 14% of all additional jobs created.
| Council | Additional Jobs Created | % of total |
| Antrim & Newtownabbey | 337 | 3% |
| Ards & North Down | 240 | 2% |
| Armagh, Banbridge & Craigavon | 1,369 | 13% |
| Belfast | 3,608 | 33% |
| Causeway Coast & Glens | 398 | 4% |
| Derry and Strabane | 571 | 5% |
| Fermanagh & Omagh | 527 | 5% |
| Lisburn & Castlereagh | 939 | 9% |
| Mid & East Antrim | 322 | 3% |
| Mid Ulster | 1,562 | 14% |
| Newry, Mourne &Down | 1,059 | 10% |
| Total | 10,932 | – |
Table 1: Additional jobs created 2017-18 by council area
Conclusions
Increased access to Invest NI information and data certainly allows for greater examination of its performance. It also helps in increasing understanding and awareness of Invest NI’s activity, including identification of its geographic and sectoral impacts. This helps to examine the extent to which there has been lower demand from businesses in certain areas for Invest NI financial support, identifying and tracking apparent patterns and trends. It also assists in trying to find out why those lower demand areas exist and to ask more questions, such as: are fewer businesses seeking to locate in those areas? If so, what can be done across government to stimulate such demand in those areas, or to increase the attractiveness of those areas to investors?
Perhaps useful in starting to address these issues is a draft strategy published by the Department for the Economy in January 2017, entitled Economy 2030: a draft Industrial Strategy for Northern Ireland? It outlined a ‘vision for 2030’ at that time, which suggested addressing these type of questions would be key to the draft strategy’s priorities. To this end, its vision for NI in 2030 is one in which the region is, amongst other things, more enterprising, has a higher rate of start-up companies, and where prosperity is spread throughout the NI. In theory successful implementation of this vision could improve overall demand from businesses across NI for Invest NI support, helping to facilitate more equal distribution of such support offers and their actual provision.
The draft strategy also sought to enhance the supply of skills to business, improve NI’s key economic infrastructure and make NI a ‘strong global presence as the location of choice to invest’. Successful delivery of these would help to enhance NI’s attractiveness to investors.
However, advancing the draft strategy is unclear at present, given its draft status and recent judicial reviews on departmental decision-making in the absence of the Executive.