This blog post provides an overview of Northern Ireland’s (NI) current position with regard to trade in goods and updates our previous blog on NI’s trade in goods in 2017. It uses the most recent annual data from the HM Revenue and Customs’ (HMRC) Regional Trade Statistics [Download: Excel file].
It should be noted that HMRC’s trade statistics cover goods, excluding services. The data also only refer to NI exports i.e. sales from NI which are destined for markets outside of the United Kingdom (UK). Therefore, ‘external sales’, which are defined as sales outside of the NI, but within the UK, i.e. NI sales to Great Britain (GB) are not included. For estimates of both services exports and sales to GB, which are beyond the scope of this blog, readers may wish to refer to the NI Statistic and Research Agency’s Broad Economy Sales and Exports publication.
Growing NI’s export base has been a key pillar of the Executive’s Economic Strategy for some time. The Executive’s 2012 Economic Strategy’s ‘path to competiveness’ was predicated on ‘a larger and more export-driven private sector’, leading to increased employment and wealth.
In March 2016, the Department for the Economy (DfE) published ‘Export Matters’; an action plan aimed at increasing the value of exports and external sales outside of NI by 80% by 2025.
Most recently, the DfE released ‘Economy 2030 – draft industrial strategy’. This too had a global focus, prioritising ‘succeeding in global markets’ among its pillars for growth. Underpinning this desire to succeed in global markets, is a drive to increase the ‘value of sales by local businesses made outside NI’.
Trade performance
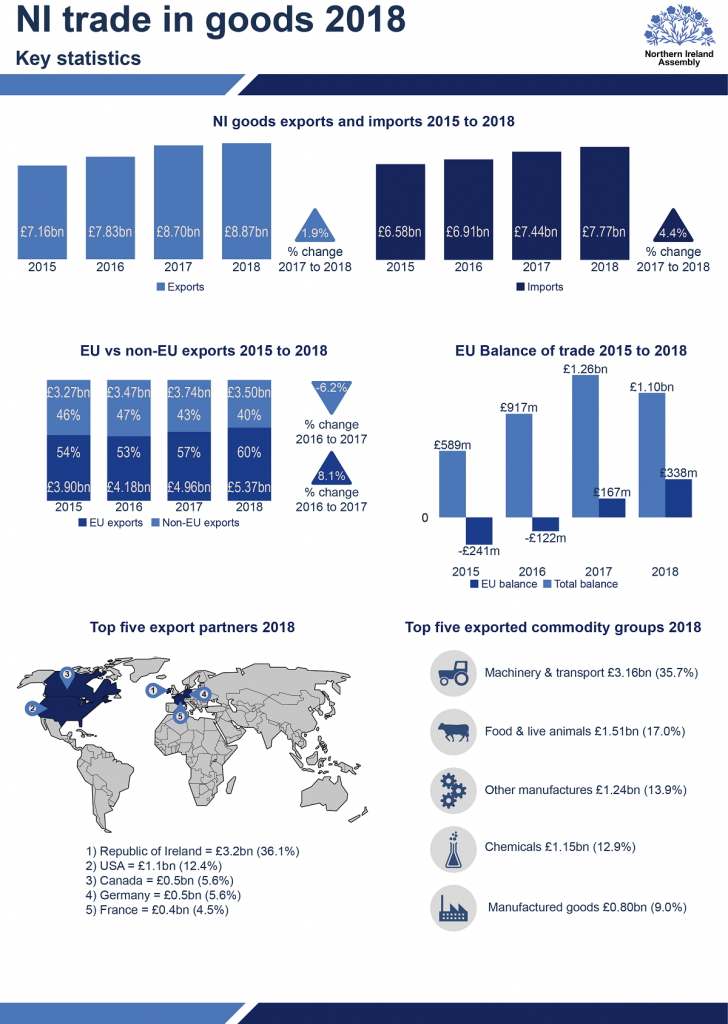
In 2018, NI goods exports were valued at £8.87 billion (bn). This represented an increase of 1.9% on the previous year, when exports were valued £8.70bn. The infographic above shows that NI’s exports grew each year from to 2015 to 2018. The growth rate has slowed, however. The value of exports in 2017 was 11% greater than in 2016; whereas in 2018, the export value was 1.9% greater than in 2017.
Imports also have shown year-on-year growth since 2015. In 2018, NI imports were valued at £7.77bn; a 4.4% increase on the previous year.
By value, over the 2015 to 2018 period, the EU, as a trade bloc, has consistently been the destination for the largest proportion of NI goods exports. Since 2016, the proportion of NI goods exports sold to the EU has increased, reaching 60% of total goods exports in 2018, when they were valued at £5.37bn. Exports to the rest of the world were valued at £3.50bn in the same year.
Balance of trade
Since 2015, based on the latest HMRC data, NI has consistently exported more than it has imported each year. In 2018, NI had a trade surplus of £1.10bn. This represented a decrease on the previous year when NI’s trade surplus was valued at £1.26bn.
Since 2017, NI operated a trade surplus with the EU. This increased in 2018 to £338m. In the two years prior to 2017 NI purchased more imports from the EU than it sold to it. In 2015 NI’s trade deficit with the EU was valued at -£241m, which fell to -£122m in 2016.
Key markets and commodity groups
The EU as a trade bloc is the destination for more than half of NI goods exports. On a country by country basis, however, the Republic of Ireland (RoI) remains NI’s key export partner. In 2018, goods exports to the RoI were valued at £3.2bn, equivalent to 36.1% of NI’s total goods exports value and approximately 60% of the value of goods exported to the EU. The United States (US) was NI’s second most significant export partner in that same year. Goods exports to the US were valued at £1.1bn in 2018, equivalent to 12.4% of total exports, and 31% of non-EU exports.
Machinery and transport equipment continued to be NI’s number one export commodity group in 2018. Exports of this type were valued at £3.16bn, or 35.7% of NI’s total goods export value. The infographic details the next four, in value order, exported commodity groups.
Conclusion
HMRC’s data on regional trade shows that NI exports continued to grow during 2018. Overall exports grew by 1.9% from 2017 levels. This is lower than the rate of annual growth experienced in NI during 2017, when exports grew by 11% on the previous year. The largest proportion of these exports (60%) went to the EU, and the RoI continued to be the most important single country destination for NI exports –36.1% of total exports in 2018. The 2018 data shows the US to be the second largest single country destination for NI exports – 12.4% of total exports in 2017. Imports also continued to grow during 2017.
Significantly in 2017, NI’s balance of trade with the EU moved from deficit to a surplus. This trend continued in 2018. With NI having sold more to the EU than it purchases from it.